Rogers 2003 Annual Report Download - page 101
Download and view the complete annual report
Please find page 101 of the 2003 Rogers annual report below. You can navigate through the pages in the report by either clicking on the pages listed below, or by using the keyword search tool below to find specific information within the annual report.-
 1
1 -
2
-
3
-
4
-
5
-
6
-
7
-
8
-
9
-
10
-
11
-
12
-
13
-
14
-
15
-
16
-
17
-
18
-
19
-
20
-
21
-
22
-
23
-
24
-
25
-
26
-
27
-
28
-
29
-
30
-
31
-
32
-
33
-
34
-
35
-
36
-
37
-
38
-
39
-
40
-
41
-
42
-
43
-
44
-
45
-
46
-
47
-
48
-
49
-
50
-
51
-
52
-
53
-
54
-
55
-
56
-
57
-
58
-
59
-
60
-
61
-
62
-
63
-
64
-
65
-
66
-
67
-
68
-
69
-
70
-
71
-
72
-
73
-
74
-
75
-
76
-
77
-
78
-
79
-
80
-
81
-
82
-
83
-
84
-
85
-
86
-
87
-
88
-
89
-
90
-
 91
91 -
 92
92 -
 93
93 -
 94
94 -
 95
95 -
 96
96 -
 97
97 -
 98
98 -
 99
99 -
 100
100 -
 101
101 -
 102
102 -
 103
103 -
 104
104 -
 105
105 -
 106
106 -
 107
107 -
 108
108 -
 109
109 -
 110
110 -
 111
111 -
112
 |
 |

2003 Annual ReportRogers Communications Inc. 99
Notes to Consolidated Financial Statements
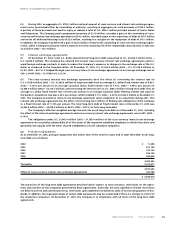
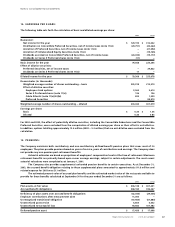
The Company makes contributions to the plans to secure the benefits of plan members and invests in permitted
investments using the target ranges established by the Pension Committee of the Company. The Pension Committee
reviews actuarial assumptions on an annual basis. The assumptions established including the expected long-term rate of
return are based on existing performance and trends and expected results.
Contributions:
Employer Employee Total
Actual contributions during 2002 $ – $ 13,426 $ 13,426
Actual contributions during 2003 11,000 13,248 24,248
Expected contributions during 2004 9,680 13,500 23,180
Employee contributions for 2004 are assumed to be at levels similar to 2002 and 2003 on the assumption staffing levels in
the Company will remain the same on a year-over-year basis.
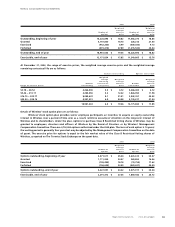
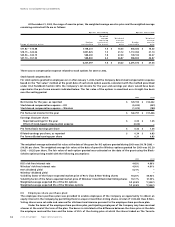
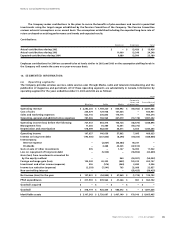
16. SEGMENTED INFORMATION:
(a) Operating segments:
The Company provides wireless services, cable services and, through Media, radio and television broadcasting and the
publication of magazines and periodicals. All of these operating segments are substantially in Canada. Information by
operating segment for the years ended December 31, 2003 and 2002 are as follows:
2003
Corporate
items and Consolidated
Wireless Cable Media eliminations total
Operating revenue $ 2,282,203 $ 1,769,220 $ 854,992 $ (59,052) $ 4,847,363
Cost of sales 244,479 129,938 131,534 – 505,951
Sales and marketing expenses 522,716 206,843 175,715 – 905,274
Operating, general and administrative expenses 787,436 768,965 441,019 (10,178) 1,987,242
Operating income (loss) before the following 727,572 663,474 106,724 (48,874) 1,448,896
Management fees 11,336 35,385 12,551 (59,272) –
Depreciation and amortization 518,599 482,050 36,311 3,303 1,040,263
Operating income 197,637 146,039 57,862 7,095 408,633
Interest on long-term debt (193,506) (237,803) (8,296) (49,260) (488,865)
Intercompany:
Interest expense – (2,867) (46,380) 49,247 –
Dividends – 4,488 43,325 (47,813) –
Gain on sale of other investments 305 – 1,107 16,490 17,902
Loss on repayment of long-term debt – (5,945) – (18,894) (24,839)
Gain (loss) from investments accounted for
by the equity method – – 964 (54,997) (54,033)
Foreign exchange gain (loss) 135,242 49,302 (852) 120,015 303,707
Investment and other income (expense) 556 (516) (464) 2,680 2,256
Income tax reduction (expense) (2,393) (7,541) 703 32,088 22,857
Non-controlling interest – – – (58,425) (58,425)
Net income (loss) for the year $ 137,841 $ (54,843) $ 47,969 $ (1,774) $ 129,193
PP&E expenditures $ 411,933 $ 509,562 $ 41,266 $ 981 $ 963,742
Goodwill acquired $ – $ – $ – $ – $ –
Goodwill $ 378,719 $ 926,445 $ 586,472 $ – $ 1,891,636
Identifiable assets $ 3,107,343 $ 3,720,087 $ 1,467,149 $ 170,916 $ 8,465,495