Rogers 2003 Annual Report Download - page 41
Download and view the complete annual report
Please find page 41 of the 2003 Rogers annual report below. You can navigate through the pages in the report by either clicking on the pages listed below, or by using the keyword search tool below to find specific information within the annual report.-
 1
1 -
2
-
3
-
4
-
5
-
6
-
7
-
8
-
9
-
10
-
11
-
12
-
13
-
14
-
15
-
16
-
17
-
18
-
19
-
20
-
21
-
22
-
23
-
24
-
25
-
26
-
27
-
28
-
29
-
30
-
 31
31 -
 32
32 -
 33
33 -
 34
34 -
 35
35 -
 36
36 -
 37
37 -
 38
38 -
 39
39 -
 40
40 -
 41
41 -
 42
42 -
 43
43 -
 44
44 -
 45
45 -
 46
46 -
 47
47 -
 48
48 -
 49
49 -
 50
50 -
 51
51 -
52
-
53
-
54
-
55
-
56
-
57
-
58
-
59
-
60
-
61
-
62
-
63
-
64
-
65
-
66
-
67
-
68
-
69
-
70
-
71
-
72
-
73
-
74
-
75
-
76
-
77
-
78
-
79
-
80
-
81
-
82
-
83
-
84
-
85
-
86
-
87
-
88
-
89
-
90
-
91
-
92
-
93
-
94
-
95
-
96
-
97
-
98
-
99
-
100
-
101
-
102
-
103
-
104
-
105
-
106
-
107
-
108
-
109
-
110
-
111
-
112
 |
 |

2003 Annual ReportRogers Communications Inc. 39
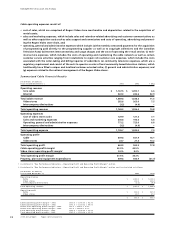
The revenue and expense changes described above led to an increase in the Cable operating margin from 40.5% in
2002 to 42.9% in 2003, reflecting the growth of Internet and the impact of cable rate increases, while video store operat-
ing margins grew to 8.4% from 8.2% in the prior year.
Cable Employees
Remuneration represents a material portion of the expenses of Cable. Cable ended the year with approximately 5,470 FTEs,
an increase of 170 employees from the 5,300 at December 31, 2002. The increase in employees is entirely attributable to
growth at the Video stores as they opened new stores and continued to focus on sales of both cable and wireless services
and products in addition to its traditional video rental and sales business.
Total remuneration paid to Cable employees (both full and part-time) in 2003 was approximately $236.6 million, an
increase of $6.0 million or 2.6% from $230.6 million in the prior year.
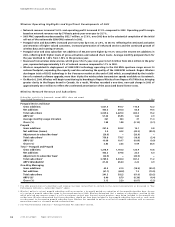
Cable PP&E Expenditures
(In millions of dollars)
Years Ended December 31, 2003 2002 % Chg
Customer premise equipment $ 181.6 $ 226.8 (19.9)
Scalable infrastructure 80.1 90.0 (11.0)
Line extensions 49.4 54.6 (9.5)
Upgrade and rebuild 114.4 185.2 (38.2)
Support capital 71.0 86.3 (17.7)
Cable PP&E expenditures 496.5 642.9 (22.8)
Video stores PP&E expenditures 13.1 8.0 63.8
Total PP&E expenditures $ 509.6 $ 650.9 (21.7)
The nature of the cable television business is such that the construction, rebuild and expansion of a cable system is highly
capital intensive. Cable categorizes its PP&E expenditures according to a standardized set of reporting categories that were
developed and agreed to by the U.S. cable television industry and which enable easier comparisons between the PP&E
expenditures of the companies. Under these industry definitions, PP&E expenditures fall into the following five categories:
• customer premise equipment (“CPE”), which includes the equipment and the associated installation costs;
• scalable infrastructure, which includes non-CPE costs to meet business growth and to provide service enhancements;
• line extensions, which includes network costs to enter new service areas;
• upgrade and rebuild, which includes the costs to modify or replace existing coax and fibre networks; and
• support capital which includes the costs associated with the replacement or enhancement of non-network assets.
For 2003, PP&E expenditures decreased $141.3 million or 21.7% from 2002 to total $509.6 million. The significant factors dri-
ving the decline were the reduction in rebuild capital as the 750 MHz portion of the rebuild program was substantially
completed in 2003 and the reductions in customer premise equipment spending driven by the declining cost of digital ter-
minals and modems.
CABLE RISKS AND UNCERTAINTIES
The cable business is subject to several operating risks and uncertainties that may result in a material adverse effect on
the business and financial results as outlined below.
Failure to Achieve Expected Growth from New Products
It is expected that a substantial portion of future growth will be achieved from new and advanced cable products,
Internet and IP products and services. Accordingly, Cable has invested significant capital resources in the development of
a technologically advanced cable network in order to support a wide variety of advanced cable products and services,
and has invested significant resources in the development of new services to be provided over the network. However,
consumers may not provide sufficient demand for the enhanced cable products and services that are offered. In addition,
any initiatives to increase prices for services may result in increased churn of subscribers and a reduction in the total num-
ber of subscribers. Alternatively, Cable may fail to anticipate demand for certain products and services, or may not be
able to offer or market these new retain existing subscribers while increasing pricing or products and services success-
fully to subscribers. Cable’s failure to attract subscribers, to retain existing subscribers while increasing pricing or new
products and services, or failure to keep pace with changing consumer preferences for cable and Internet services, could
slow revenue growth and have a material adverse effect on Cable’s business and financial condition.
Management’s Discussion and Analysis