Rogers 2003 Annual Report Download - page 102
Download and view the complete annual report
Please find page 102 of the 2003 Rogers annual report below. You can navigate through the pages in the report by either clicking on the pages listed below, or by using the keyword search tool below to find specific information within the annual report.-
 1
1 -
2
-
3
-
4
-
5
-
6
-
7
-
8
-
9
-
10
-
11
-
12
-
13
-
14
-
15
-
16
-
17
-
18
-
19
-
20
-
21
-
22
-
23
-
24
-
25
-
26
-
27
-
28
-
29
-
30
-
31
-
32
-
33
-
34
-
35
-
36
-
37
-
38
-
39
-
40
-
41
-
42
-
43
-
44
-
45
-
46
-
47
-
48
-
49
-
50
-
51
-
52
-
53
-
54
-
55
-
56
-
57
-
58
-
59
-
60
-
61
-
62
-
63
-
64
-
65
-
66
-
67
-
68
-
69
-
70
-
71
-
72
-
73
-
74
-
75
-
76
-
77
-
78
-
79
-
80
-
81
-
82
-
83
-
84
-
85
-
86
-
87
-
88
-
89
-
90
-
91
-
 92
92 -
 93
93 -
 94
94 -
 95
95 -
 96
96 -
 97
97 -
 98
98 -
 99
99 -
 100
100 -
 101
101 -
 102
102 -
 103
103 -
 104
104 -
 105
105 -
 106
106 -
 107
107 -
 108
108 -
 109
109 -
 110
110 -
 111
111 -
 112
112
 |
 |

2003 Annual Report Rogers Communications Inc.
100
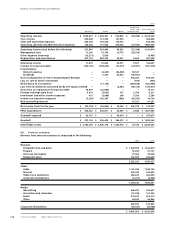
Notes to Consolidated Financial Statements
2002
Corporate
items and Consolidated
Wireless Cable Media eliminations total
Operating revenue $ 1,965,927 $ 1,596,401 $ 810,805 $ (50,088) $ 4,323,045
Cost of sales 209,948 121,335 127,555 – 458,838
Sales and marketing expenses 462,784 193,644 176,610 – 833,038
Operating, general and administrative expenses 765,508 717,942 419,005 (12,900) 1,889,555
Operating income (loss) before the following 527,687 563,480 87,635 (37,188) 1,141,614
Management fees 11,006 31,745 10,773 (53,524) –
Other expense (recovery) (12,331) 5,850 – – (6,481)
Depreciation and amortization 457,133 484,225 33,291 6,809 981,458
Operating income 71,879 41,660 43,571 9,527 166,637
Interest on long-term debt (195,150) (208,645) (13,477) (74,007) (491,279)
Intercompany:
Interest expense – (4,687) (54,854) 59,541 –
Dividends – 5,447 63,534 (68,981) –
Gain on disposition of AT&T Canada Deposit Receipts – – – 904,262 904,262
Loss on sale of other investments – – – (565) (565)
Write-down of investments (11,136) – (289,848) (300,984)
Loss from investments accounted for by the equity method – – (2,481) (98,136) (100,617)
Gain (loss) on repayment of long-term debt 30,997 (20,880) – – 10,117
Foreign exchange gain (loss) 6,410 (3,090) 107 2,784 6,211
Investment and other income (expense) 417 (3,886) 208 5,550 2,289
Income tax reduction (expense) (5,258) 146,387 (840) (65,559) 74,730
Non-controlling interest – – – 41,231 41,231
Net income (loss) for the year $ (90,705) $ (58,830) $ 35,768 $ 425,799 $ 312,032
PP&E expenditures $ 564,552 $ 650,871 $ 42,692 $ 3,868 $ 1,261,983
Goodwill acquired $ 92,157 $ – $ 94,914 $ – $ 187,071
Goodwill $ 379,143 $ 926,445 $ 586,472 $ – $ 1,892,060
Identifiable assets $ 3,185,004 $ 3,806,778 $ 1,453,579 $ 79,142 $ 8,524,503
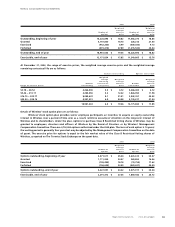
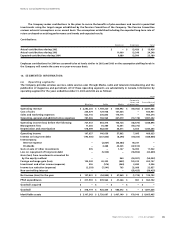
(b) Product revenue:
Revenue from external customers is comprised of the following:
2003 2002
Wireless:
Postpaid (voice and data) $ 1,920,993 $ 1,632,874
Prepaid 91,255 91,151
One-way messaging 27,565 35,238
Equipment sales 242,390 206,664
2,282,203 1,965,927
Cable:
Cable 1,167,496 1,095,736
Internet 322,290 242,635
Video store operations 282,635 262,995
Corporate eliminations (3,201) (4,965)
1,769,220 1,596,401
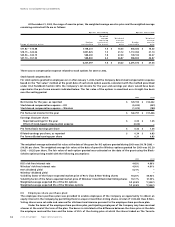
Media:
Advertising 456,357 422,627
Circulation and subscriber 127,258 121,094
Retail 210,547 202,219
Other 60,830 64,865
854,992 810,805
Corporate eliminations (59,052) (50,088)
$ 4,847,363 $ 4,323,045