Rogers 2003 Annual Report Download - page 103
Download and view the complete annual report
Please find page 103 of the 2003 Rogers annual report below. You can navigate through the pages in the report by either clicking on the pages listed below, or by using the keyword search tool below to find specific information within the annual report.-
 1
1 -
2
-
3
-
4
-
5
-
6
-
7
-
8
-
9
-
10
-
11
-
12
-
13
-
14
-
15
-
16
-
17
-
18
-
19
-
20
-
21
-
22
-
23
-
24
-
25
-
26
-
27
-
28
-
29
-
30
-
31
-
32
-
33
-
34
-
35
-
36
-
37
-
38
-
39
-
40
-
41
-
42
-
43
-
44
-
45
-
46
-
47
-
48
-
49
-
50
-
51
-
52
-
53
-
54
-
55
-
56
-
57
-
58
-
59
-
60
-
61
-
62
-
63
-
64
-
65
-
66
-
67
-
68
-
69
-
70
-
71
-
72
-
73
-
74
-
75
-
76
-
77
-
78
-
79
-
80
-
81
-
82
-
83
-
84
-
85
-
86
-
87
-
88
-
89
-
90
-
91
-
92
-
 93
93 -
 94
94 -
 95
95 -
 96
96 -
 97
97 -
 98
98 -
 99
99 -
 100
100 -
 101
101 -
 102
102 -
 103
103 -
 104
104 -
 105
105 -
 106
106 -
 107
107 -
 108
108 -
 109
109 -
 110
110 -
 111
111 -
 112
112
 |
 |

2003 Annual ReportRogers Communications Inc. 101
Notes to Consolidated Financial Statements
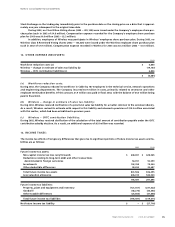
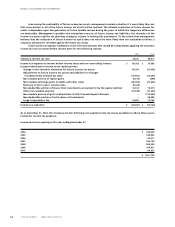
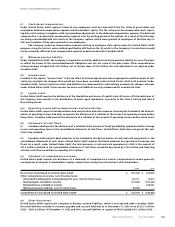
17. RELATED PARTY TRANSACTIONS:
The Company entered into the following related party transactions:
(a) The Company has entered into certain transactions in the normal course of business with AT&T Wireless Services
Inc. (“AWE”), a shareholder of a subsidiary company, and with certain broadcasters in which the Company has an equity
interest as follows:
2003 2002
Roaming revenue billed to AWE $ 13,030 $ 13,910
Roaming expenses paid to AWE (13,628) (18,028)
Fees paid to AWE for over air activation (292) (680)
Programming rights acquired from the Blue Jays (12,028) (12,377)
Access fees paid to broadcasters accounted for by the equity method (18,967) (16,949)
$ (31,885) $ (34,124)
These transactions are recorded at the exchange amount, being the amount agreed to by the related parties.
(b) The Company has entered into certain transactions with companies, the partners or senior officers of which are
directors of the Company and/or its subsidiary companies. During 2003, total amounts paid by the Company to these related
parties for legal services, commissions paid on premiums for insurance coverage and other services aggregated $6.1 million
(2002 – $7.0 million), for interest charges of $15.1 million (2002 – $8.5 million) and for underwriting fees related to financing
transactions and telecommunications and programming services amounted to $59.2 million (2002 – $60.4 million).
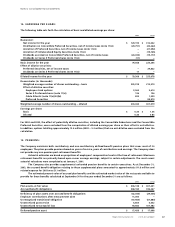
(c) As part of the arrangement with Blue Jays Holdco and RTL, Blue Jays Holdco is to pay dividends at a rate of 9.167%
per annum on the Class A Preferred Shares that RTL holds of Blue Jays Holdco. During 2003 and 2002, the Company satis-
fied the dividend by transferring income tax loss carryforwards to RTL (note 6(a)).
(d) The Company also received $0.2 million (2002 – $0.1 million) from RTL for rent and office services.
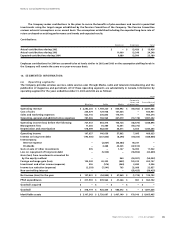
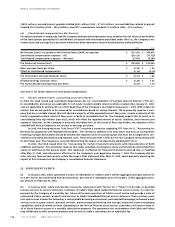
18. FINANCIAL INSTRUMENTS:
(a) Fair values:
The Company has determined the fair values of its financial instruments as follows:
(i) The carrying amounts in the consolidated balance sheets of cash and cash equivalents, accounts receivable,
amounts receivable from employees under share purchase plans, mortgages and loans receivable, bank advances arising
from outstanding cheques, and accounts payable and accrued liabilities approximate fair values because of the short-
term nature of these instruments.
(ii) Investments:
The fair values of investments, which are publicly traded, are determined by the quoted market values for each of the
investments (note 6). Management believes that the fair values of other investments are not significantly different from
their carrying amounts.
(iii) Long-term debt:
The fair values of each of the Company’s long-term debt instruments are based on the period-end trading values.
(iv) Interest exchange agreements:
The fair values of the Company’s interest exchange agreements and cross-currency interest rate exchange agreements
are based on values quoted by the counterparties to the agreements.
The estimated fair values of the Company’s long-term debt and related interest exchange agreements as at
December 31, 2003 and 2002 are as follows:
2003 2002
Carrying Estimated Carrying Estimated
amount fair value amount fair value
Liability (asset):
Long-term debt $ 4,970,232 $ 5,382,622 $ 5,869,701 $ 5,617,465
Cross-currency interest rate exchange agreements 334,784 388,192 (182,230) (350,502)
$ 5,305,016 $ 5,770,814 $ 5,687,471 $ 5,266,963