Rogers 2003 Annual Report Download - page 72
Download and view the complete annual report
Please find page 72 of the 2003 Rogers annual report below. You can navigate through the pages in the report by either clicking on the pages listed below, or by using the keyword search tool below to find specific information within the annual report.-
 1
1 -
2
-
3
-
4
-
5
-
6
-
7
-
8
-
9
-
10
-
11
-
12
-
13
-
14
-
15
-
16
-
17
-
18
-
19
-
20
-
21
-
22
-
23
-
24
-
25
-
26
-
27
-
28
-
29
-
30
-
31
-
32
-
33
-
34
-
35
-
36
-
37
-
38
-
39
-
40
-
41
-
42
-
43
-
44
-
45
-
46
-
47
-
48
-
49
-
50
-
51
-
52
-
53
-
54
-
55
-
56
-
57
-
58
-
59
-
60
-
61
-
 62
62 -
 63
63 -
 64
64 -
 65
65 -
 66
66 -
 67
67 -
 68
68 -
 69
69 -
 70
70 -
 71
71 -
 72
72 -
 73
73 -
 74
74 -
 75
75 -
 76
76 -
 77
77 -
 78
78 -
 79
79 -
 80
80 -
 81
81 -
 82
82 -
83
-
84
-
85
-
86
-
87
-
88
-
89
-
90
-
91
-
92
-
93
-
94
-
95
-
96
-
97
-
98
-
99
-
100
-
101
-
102
-
103
-
104
-
105
-
106
-
107
-
108
-
109
-
110
-
111
-
112
 |
 |

2003 Annual Report Rogers Communications Inc.
70
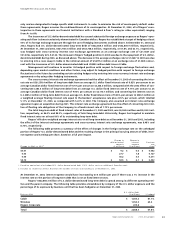
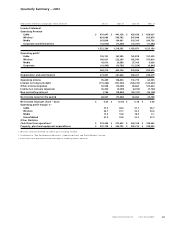
(thousands of dollars, except per share amounts) Dec 31 Sept 30 June 30 Mar 31
Income Statement
Operating Revenue
Cable $ 422,446 $ 404,422 $ 389,060 $ 380,473
Wireless1525,652 520,233 481,716 438,326
Media 233,023 187,395 213,570 176,817
Corporate and eliminations (14,124) (12,945) (12,035) (10,984)
1,166,997 1,099,105 1,072,311 984,632
Operating profit2
Cable 156,328 139,771 136,067 131,314
Wireless 123,148 160,906 132,782 110,851
Media 34,468 18,804 30,129 4,234
Corporate (10,483) (8,717) (10,630) (7,358)
303,461 310,764 288,348 239,041
Other expense (recovery) 5,850 – – (12,331)
Depreciation and amortization 251,836 246,534 247,227 235,861
Operating income 45,775 64,230 41,121 15,511
Interest on long-term debt (131,502) (133,107) (118,035) (108,635)
Other income (expense) 798,569 (48,692) (216,923) (12,241)
Income tax recovery (expense) (31,832) 11,564 105,365 (10,367)
Non-controlling interest 17,145 6,241 (324) 18,169
Net income (loss) for the period 698,155 (99,764) (188,796) (97,563)
Net income (loss) per share – basic $ 3.22 $ (0.68) $ (0.96) $ (0.53)
Operating profit margin %2
Cable 37.0 34.6 35.0 34.5
Wireless 23.4 30.9 27.6 25.3
Media 14.8 10.0 14.1 2.4
Consolidated 26.0 28.3 26.9 24.3
Other Statistics
Cash flow from operations3$ 168,679 $ 173,344 $ 174,415 $ 125,995
Property, plant and equipment expenditures $ 389,925 $ 305,359 $ 324,656 $ 242,043
1 Wireless revenue restated to reflect gross roaming revenue.
2 As defined in “Key Performance Indicators – Operating Profit and Profit Margin” section.
3 Cash flow from operations before changes in working capital amounts.
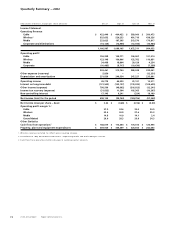
Quarterly Summary – 2002