Rogers 2003 Annual Report Download - page 60
Download and view the complete annual report
Please find page 60 of the 2003 Rogers annual report below. You can navigate through the pages in the report by either clicking on the pages listed below, or by using the keyword search tool below to find specific information within the annual report.-
 1
1 -
2
-
3
-
4
-
5
-
6
-
7
-
8
-
9
-
10
-
11
-
12
-
13
-
14
-
15
-
16
-
17
-
18
-
19
-
20
-
21
-
22
-
23
-
24
-
25
-
26
-
27
-
28
-
29
-
30
-
31
-
32
-
33
-
34
-
35
-
36
-
37
-
38
-
39
-
40
-
41
-
42
-
43
-
44
-
45
-
46
-
47
-
48
-
49
-
 50
50 -
 51
51 -
 52
52 -
 53
53 -
 54
54 -
 55
55 -
 56
56 -
 57
57 -
 58
58 -
 59
59 -
 60
60 -
 61
61 -
 62
62 -
 63
63 -
 64
64 -
 65
65 -
 66
66 -
 67
67 -
 68
68 -
 69
69 -
 70
70 -
71
-
72
-
73
-
74
-
75
-
76
-
77
-
78
-
79
-
80
-
81
-
82
-
83
-
84
-
85
-
86
-
87
-
88
-
89
-
90
-
91
-
92
-
93
-
94
-
95
-
96
-
97
-
98
-
99
-
100
-
101
-
102
-
103
-
104
-
105
-
106
-
107
-
108
-
109
-
110
-
111
-
112
 |
 |

2003 Annual Report Rogers Communications Inc.
58
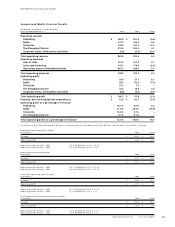
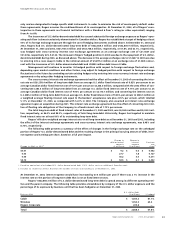
Change in Net Income (Loss)
(In millions of dollars)
Operating profit $ 307.3
Other (6.5)
Depreciation and amortization (58.8)
Operating income 242.0
Interest on long-term debt 2.4
Losses from investments accounted for by the equity method 46.6
Foreign exchange gain 297.5
Gain (loss) on repayment of long-term debt (34.9)
Gain (loss) on sale of other investments 18.5
Writedown of investments 301.0
Gains on disposition of AT&T Canada Deposit Receipts (904.3)
Other income (0.2)
Income taxes (51.8)
Non-controlling interest (99.6)
Net income $ (182.8)
• In 2002, the Company had a net recovery of $6.5 million, made up primarily of a reduction in the liability related to esti-
mates of sales tax at Wireless of $19.2 million, partially offset by workforce reduction costs at Cable of $5.9 million and
a change in the estimate of CRTC contribution liability at Wireless of $6.8 million.
• The $58.8 million increase in depreciation and amortization is mainly due to an increase in the fixed asset base during
the year, of which a significant component is related to PP&E expenditures for the Cable network upgrades and capac-
ity expansion to the new GSM/GPRS network at Wireless, and the acceleration of the amortization of the $20.0 million
in brand licence cost.
• The $2.4 million decrease in interest expense is due to the decrease in debt during the year.
• The $46.6 million decrease in losses from investments accounted for by the equity method is primarily related to the
reduction in the equity losses of the Blue Jays.
• The $297.5 million increase in foreign exchange gains was due to the continuing strengthening of the Canadian dollar
throughout 2003 which favourably impacted the translation of the unhedged portion of the Company’s U.S. dollar-
denominated long-term debt.
• The $34.9 million change in the gain (loss) on early repayment of long-term debt reflects the impact of transactions in
2003 versus 2002 as further detailed in the discussion below.
• The $18.5 million gain from sale on investments is a result of the sale of certain marketable securities by the Company
during the year.
• The $301.0 million decrease in writedowns on investments is a result of the Company’s review of the value of its invest-
ments in publicly traded and private companies and provision recorded in 2002.
• The $904.3 million decrease in the gain on disposition of AT&T Canada Deposit Receipts was a result of the sale on
October 8, 2002 of 25 million AT&T Canada Deposit Receipts owned by the Company.
• The $51.8 million change in income taxes was due to lower net tax reductions in 2003 compared to 2002 and is calcu-
lated under Canadian GAAP as outlined in Note 13 to the Consolidated Financial Statements.
• The $99.6 million change in non-controlling interest represents the Wireless minority shareholders’ share of the net
income of Wireless in 2003 compared to their share of the 2002 loss.
Rogers’ cash generated from operations before changes in non-cash operating items, which is calculated by adding back all
non-cash items such as depreciation and amortization to net income, increased to $984.7 million in 2003 from $642.4 million
in 2002. This $342.3 million increase in 2003 is mainly due to the $307.3 million increase in operating income before certain
items. Taking into account the changes in non-cash operating items for the 2003 year, cash generated from operations
increased by $85.4 million to $853.9 million from $768.5 million in 2002.
In addition, Rogers raised net funds totaling $796.7 million during 2003 consisting of:
• $524.0 million received from the increase of long-term debt, which is essentially comprised of Cable’s U.S. Note offering
totaling U.S.$350 million (C$470.4 million) issued in June 2003 and the net drawdowns under bank credit facilities during
the year of $51.5 million and a $2.1 million net increase in capital leases, mortgages and other;
• proceeds on the sale of investments of $20.7 million; and
• $252.0 million cash proceeds received from the issuance of equity, of which $13.0 million was received for the issuance
of Class B Non-Voting Shares under employee share purchase plans and the exercise of employee stock options and
$239.0 million was received upon the issuance of 12,722,647 Class B Non-Voting Shares in May 2003.
Management’s Discussion and Analysis