Rogers 2003 Annual Report Download - page 30
Download and view the complete annual report
Please find page 30 of the 2003 Rogers annual report below. You can navigate through the pages in the report by either clicking on the pages listed below, or by using the keyword search tool below to find specific information within the annual report.-
 1
1 -
2
-
3
-
4
-
5
-
6
-
7
-
8
-
9
-
10
-
11
-
12
-
13
-
14
-
15
-
16
-
17
-
18
-
19
-
 20
20 -
 21
21 -
 22
22 -
 23
23 -
 24
24 -
 25
25 -
 26
26 -
 27
27 -
 28
28 -
 29
29 -
 30
30 -
 31
31 -
 32
32 -
 33
33 -
 34
34 -
 35
35 -
 36
36 -
 37
37 -
 38
38 -
 39
39 -
 40
40 -
41
-
42
-
43
-
44
-
45
-
46
-
47
-
48
-
49
-
50
-
51
-
52
-
53
-
54
-
55
-
56
-
57
-
58
-
59
-
60
-
61
-
62
-
63
-
64
-
65
-
66
-
67
-
68
-
69
-
70
-
71
-
72
-
73
-
74
-
75
-
76
-
77
-
78
-
79
-
80
-
81
-
82
-
83
-
84
-
85
-
86
-
87
-
88
-
89
-
90
-
91
-
92
-
93
-
94
-
95
-
96
-
97
-
98
-
99
-
100
-
101
-
102
-
103
-
104
-
105
-
106
-
107
-
108
-
109
-
110
-
111
-
112
 |
 |

2003 Annual Report Rogers Communications Inc.
28
Media represent 45.8%, 50.2%, and 7.4%, respectively, of Rogers consolidated operating profit, offset by negative 3.4%,
representing corporate expenses. See “Key Performance Indicators – Operating Profit and Operating Profit Margin” section.
For more detailed discussions of the Cable, Wireless and Media divisions, please refer to the respective segment discus-
sions below.
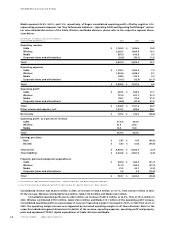
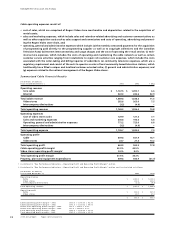
(In millions of dollars, per share amounts)
Years Ended December 31, 2003 2002 % Chg
Operating revenue
Cable $ 1,769.2 $ 1,596.4 10.8
Wireless 2,282.2 1,965.9 16.1
Media 855.0 810.8 5.5
Corporate items and eliminations (59.0) (50.1) 17.8
Total 4,847.4 4,323.0 12.1
Operating expenses
Cable $ 1,105.7 1,032.9 7.0
Wireless 1,554.6 1,438.2 8.1
Media 748.3 723.2 3.5
Corporate items and eliminations (10.1) (12.9) (21.7)
Total $ 3,398.5 $ 3,181.4 6.8
Operating profit1
Cable $ 663.5 $ 563.5 17.7
Wireless 727.6 527.7 37.9
Media 106.7 87.6 21.8
Corporate items and eliminations (48.9) (37.2) 31.5
Total $ 1,448.9 $ 1,141.6 26.9
Other income and expense, net21,319.7 829.6 59.1
Net income $ 129.2 $ 312.0 (58.6)
Operating profit1as a percent of revenue
Cable 37.5% 35.3%
Wireless 31.9 26.8
Media 12.5 10.8
Total 29.9% 26.4%
Earnings per share
Basic $ 0.35 $ 1.05 (66.6)
Diluted $ 0.34 $ 0.83 (59.0)
Total assets $ 8,465.5 $ 8,524.5 (0.7)
Total liabilities $ 6,504.8 $ 6,987.9 (6.9)
Property, plant and equipment expenditures:
Cable $ 509.6 $ 650.9 (21.7)
Wireless 411.9 564.5 (27.0)
Media 41.3 42.7 (3.3)
Corporate items and eliminations 0.9 3.9 (76.9)
Total $ 963.7 $ 1,262.0 (23.6)
1 As defined in “Key Performance Indicators – Operating Profit and Operating Profit Margin”.
2 See “Reconciliation of Operating Profit to Net Income for specific details of these amounts.
Consolidated revenue was $4,847.4 million in 2003, an increase of $524.4 million, or 12.1%, from $4,323.0 million in 2002.
Of the increase, Wireless contributed $316.3 million, Cable $172.8 million and Media $44.2 million.
Consolidated operating profit was $1,448.9 million, an increase of $307.3 million, or 26.9%, from $1,141.6 million in
2002. Wireless contributed $199.9 million, Cable $100.0 million and Media $19.1 million of the operating profit increase.
Consolidated operating profit as a percentage of revenue (“operating margin”) increased to 29.9% in 2003 from 26.4% in
2002. The operating margin increase was supported by increased operating margins in all three divisions. Refer to the
respective individual segment discussions for details of the revenue, operating expenses, operating profit and property,
plant and equipment (“PP&E”) capital expenditures of Cable, Wireless and Media.
Management’s Discussion and Analysis