Rogers 2003 Annual Report Download - page 40
Download and view the complete annual report
Please find page 40 of the 2003 Rogers annual report below. You can navigate through the pages in the report by either clicking on the pages listed below, or by using the keyword search tool below to find specific information within the annual report.-
 1
1 -
2
-
3
-
4
-
5
-
6
-
7
-
8
-
9
-
10
-
11
-
12
-
13
-
14
-
15
-
16
-
17
-
18
-
19
-
20
-
21
-
22
-
23
-
24
-
25
-
26
-
27
-
28
-
29
-
 30
30 -
 31
31 -
 32
32 -
 33
33 -
 34
34 -
 35
35 -
 36
36 -
 37
37 -
 38
38 -
 39
39 -
 40
40 -
 41
41 -
 42
42 -
 43
43 -
 44
44 -
 45
45 -
 46
46 -
 47
47 -
 48
48 -
 49
49 -
 50
50 -
51
-
52
-
53
-
54
-
55
-
56
-
57
-
58
-
59
-
60
-
61
-
62
-
63
-
64
-
65
-
66
-
67
-
68
-
69
-
70
-
71
-
72
-
73
-
74
-
75
-
76
-
77
-
78
-
79
-
80
-
81
-
82
-
83
-
84
-
85
-
86
-
87
-
88
-
89
-
90
-
91
-
92
-
93
-
94
-
95
-
96
-
97
-
98
-
99
-
100
-
101
-
102
-
103
-
104
-
105
-
106
-
107
-
108
-
109
-
110
-
111
-
112
 |
 |

2003 Annual Report Rogers Communications Inc.
38
In its analog cable service, Cable offers three expanded analog channel groupings called tiers in addition to its
basic cable offering. At December 31, 2003, 81.2% of basic cable service customers also subscribed to one or more tier ser-
vices, compared to 81.9% at December 31, 2002. Cable ended the year with approximately 661,600 customers who
subscribe to multiple plans and participate in the Cable’s high-value customer loyalty program, which cable refers to as
its “VIP” program.
Internet Revenue
Internet revenue for 2003 was $322.3 million, representing growth of $79.7 million, or 32.9%, from 2002, and reflecting the
significant increase in the number of subscribers. Average revenue per Internet subscriber per month for 2003 was $37.58,
an increase from $37.13 for 2002, reflecting continued strong sales of the Internet product offering and sales of the higher
priced business Internet offering, partially offset by customer additions to Cable’s lower priced Internet Lite product.
Year-over-year, the Internet subscriber base has grown by 151,100, or 23.6%, resulting in 34.8% Internet penetration of
basic cable households, or 24.6% Internet penetration as a percentage of cable homes passed.
Video Stores Revenue
Video stores revenue grew by $19.6 million, or 7.5%, to $282.6 million for 2003 driven by a combination of the opening of
7 stores and a 4.4% increase in same store revenues. “Same stores” are stores that were open for a full year in both 2003
and 2002. At the end of 2003, many of the 279 Rogers Video stores were integrated Rogers Video stores that offered access
to a wide variety of cable and wireless products and services in addition to the core video rental and sales offerings.
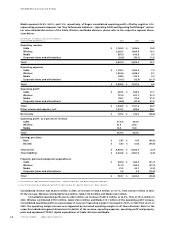
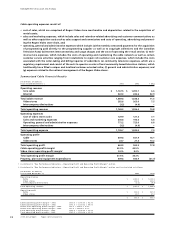
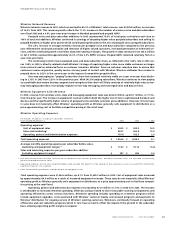
Cable and Video Operating Expenses
(In millions of dollars)
Years Ended December 31, 2003 2002 % Chg
Cable operating expenses
Sales and marketing expenses $ 91.0 $ 84.5 7.7
Operating, general and administrative expenses 759.0 711.9 6.6
Total Cable operating expenses 850.0 796.4 6.7
Video stores operating expenses
Cost of sales 129.9 121.3 7.1
Sales and marketing expenses 115.8 109.1 6.1
Operating, general and administrative expenses 13.2 11.1 18.9
Total Video stores operating expenses 258.9 241.5 7.2
Intercompany eliminations (3.2) (4.9) –
Operating expenses $ 1,105.7 $ 1,033.0 7.0
Total Cable operating expenses of $850.0 million increased $53.6 million or 6.7% from $796.4 million in 2002.
The year-over-year increase in costs of Cable is directly attributable to the growth in Internet subscribers com-
bined with increasing penetration of digital subscribers.
Cable sales and marketing expense increased by $6.5 million or 7.7% in 2003 over 2002, primarily related to
increases in commissions and advertising costs related to Internet and digital sales. In addition, the current year’s sales
and marketing expenses include $1.8 million associated with the partial subsidy on the sale to customers of approxi-
mately 10,000 digital set-top terminals.
Cable operating, general and administrative expenses increased by $47.1 million or 6.6% in 2003 over 2002.
The increase related to increased costs of programming and Internet transit and e-mail costs, associated with the growth
in digital and Internet subscribers.
Total Rogers Video stores cost of sales increased by 7.1% in 2003 over 2002, primarily as a result of the chains’
growth from 272 stores at December 31, 2002 to 279 stores at December 31, 2003. Video sales and marketing expenses,
which include the cost of the stores, also increased by 6.1% in 2003 as compared to 2002 as a result of the increased num-
ber of stores. Video operating, general and administrative expenses increased by 18.9% as Video incurred higher costs
related to functions such as information technology and human resources.
Cable Operating Profit
For 2003, consolidated Cable operating profit grew by $100.0 million, or 17.8%, over the same period in 2002, from
$563.5 million to $663.5 million. Consolidated cable operating profit increased by $97.8 million, or 18.0%, as the impact of
higher revenues from price increases and the increase in digital and Internet penetration exceeded the increasing costs
of supporting subscribers. Video stores operating profit increased by $2.2 million, or 10.2%, as revenue growth modestly
outpaced cost growth relating to operating efficiencies and improved margins on the sale of products.
Management’s Discussion and Analysis