Rogers 2003 Annual Report Download - page 47
Download and view the complete annual report
Please find page 47 of the 2003 Rogers annual report below. You can navigate through the pages in the report by either clicking on the pages listed below, or by using the keyword search tool below to find specific information within the annual report.-
 1
1 -
2
-
3
-
4
-
5
-
6
-
7
-
8
-
9
-
10
-
11
-
12
-
13
-
14
-
15
-
16
-
17
-
18
-
19
-
20
-
21
-
22
-
23
-
24
-
25
-
26
-
27
-
28
-
29
-
30
-
31
-
32
-
33
-
34
-
35
-
36
-
 37
37 -
 38
38 -
 39
39 -
 40
40 -
 41
41 -
 42
42 -
 43
43 -
 44
44 -
 45
45 -
 46
46 -
 47
47 -
 48
48 -
 49
49 -
 50
50 -
 51
51 -
 52
52 -
 53
53 -
 54
54 -
 55
55 -
 56
56 -
 57
57 -
58
-
59
-
60
-
61
-
62
-
63
-
64
-
65
-
66
-
67
-
68
-
69
-
70
-
71
-
72
-
73
-
74
-
75
-
76
-
77
-
78
-
79
-
80
-
81
-
82
-
83
-
84
-
85
-
86
-
87
-
88
-
89
-
90
-
91
-
92
-
93
-
94
-
95
-
96
-
97
-
98
-
99
-
100
-
101
-
102
-
103
-
104
-
105
-
106
-
107
-
108
-
109
-
110
-
111
-
112
 |
 |

2003 Annual ReportRogers Communications Inc. 45
WIRELESS OPERATING AND FINANCIAL RESULTS
Year Ended December 31, 2003 Compared to Year Ended December 31, 2002
For purposes of this discussion, revenue has been classified according to the following categories:
• postpaid voice and data, revenues generated principally from
• monthly fees,
• airtime and long-distance charges,
• optional service charges,
• system access fees, and
• roaming charges;
• prepaid revenues generated principally from the advance sale of airtime, usage and long-distance charges;
• one-way messaging revenues generated from monthly fees and usage charges; and
• equipment sales revenue generated from the sale of hardware and accessories to independent dealers, agents and
retailers, and directly to subscribers through direct fulfillment by its customer service groups, Wireless’ Web site and
telesales.
Wireless’ operating expenses are segregated into three categories for assessing business performance:
• cost of equipment sales;
• sales and marketing expenses which represent all costs to acquire new subscribers, such as advertising, commissions
paid to third parties for new activations, remuneration and benefits to sales and marketing employees as well as direct
overheads related to these activities; and
• operating, general and administrative expenses, which include all other expenses incurred to operate the business on a
day-to-day basis and to service existing subscriber relationships, including retention costs, and inter-carrier payments
to roaming partners and long-distance carriers and the CRTC contribution levy.
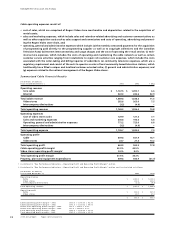
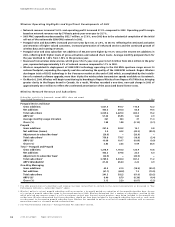
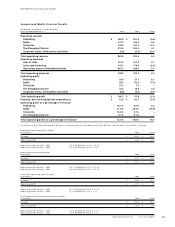
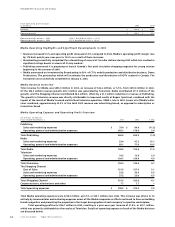
Summarized Wireless Financial Results
(In millions of dollars, except margins)
Years Ended December 31, 2003 2002 % Chg
Operating revenue
Postpaid (voice and data)1$ 1,921.0 $ 1,632.8 17.7
Prepaid 91.2 91.2 –
One-way messaging 27.6 35.2 (21.6)
Network revenue 2,039.8 1,759.2 16.0
Equipment revenue 242.4 206.7 17.3
Total operating revenue 2,282.2 1,965.9 16.1
Operating expenses
Cost of equipment sales 244.5 209.9 16.5
Sales and marketing expenses 522.7 462.8 12.9
Operating, general and administrative expenses 787.4 765.5 2.9
Total operating expenses 1,554.6 1,438.2 8.1
Operating profit2$ 727.6 $ 527.7 37.9
Operating profit margin as % of network revenue2, 3 35.7% 30.0%
Property, plant and equipment expenditures $ 411.9 $ 564.6 (27.0)
1 The prior period presentation of revenue categories has been reclassified to conform to the current presentation. See the discussion under
the “Subscriber Counts” Section in Key Performance Indicators.
2 As defined in “Key Performance Indicators – Operating Profit and Operating Profit Margin” section.
3 As defined in “Key Performance Indicators – Operating Profit and Operating Profit Margin” section and is calculated as follows:
($ millions) 2003 2002
Network revenue $ 2,039.8 $ 1,759.2
Operating profit $ 727.6 $ 527.7
Operating profit margin – 2003 $727.6 divided by $2,039.8 = 35.7%
Operating profit margin – 2002 $527.7 divided by $1,757.2 = 30.0%
Management’s Discussion and Analysis