Rogers 2003 Annual Report Download - page 38
Download and view the complete annual report
Please find page 38 of the 2003 Rogers annual report below. You can navigate through the pages in the report by either clicking on the pages listed below, or by using the keyword search tool below to find specific information within the annual report.-
 1
1 -
2
-
3
-
4
-
5
-
6
-
7
-
8
-
9
-
10
-
11
-
12
-
13
-
14
-
15
-
16
-
17
-
18
-
19
-
20
-
21
-
22
-
23
-
24
-
25
-
26
-
27
-
 28
28 -
 29
29 -
 30
30 -
 31
31 -
 32
32 -
 33
33 -
 34
34 -
 35
35 -
 36
36 -
 37
37 -
 38
38 -
 39
39 -
 40
40 -
 41
41 -
 42
42 -
 43
43 -
 44
44 -
 45
45 -
 46
46 -
 47
47 -
 48
48 -
49
-
50
-
51
-
52
-
53
-
54
-
55
-
56
-
57
-
58
-
59
-
60
-
61
-
62
-
63
-
64
-
65
-
66
-
67
-
68
-
69
-
70
-
71
-
72
-
73
-
74
-
75
-
76
-
77
-
78
-
79
-
80
-
81
-
82
-
83
-
84
-
85
-
86
-
87
-
88
-
89
-
90
-
91
-
92
-
93
-
94
-
95
-
96
-
97
-
98
-
99
-
100
-
101
-
102
-
103
-
104
-
105
-
106
-
107
-
108
-
109
-
110
-
111
-
112
 |
 |

2003 Annual Report Rogers Communications Inc.
36
Cable operating expenses consist of:
• cost of sales, which are comprised of Rogers Video store merchandise and depreciation related to the acquisition of
rental assets;
• sales and marketing expenses, which include sales and retention-related advertising and customer communications as
well as other acquisition costs such as sales support and commissions and costs of operating, advertising and promot-
ing the Rogers Video store chain, and;
• operating, general and administrative expenses which include: (a) the monthly contracted payments for the acquisition
of programming paid directly to the programming supplier as well as to copyright collectives and the Canadian
Television Fund; (b) Internet interconnectivity and usage charges and the cost of operating the e-mail service; (c) tech-
nical service expenses, which includes the costs of operating and maintaining the cable network as well as certain
customer service activities ranging from installations to repair; (d) customer care expenses, which include the costs
associated with the order-taking and billing inquiries of subscribers; (e) community television expenses, which are a
regulatory requirement and consist of the costs to operate a series of local community-based television stations, which
traditionally have filled a unique and localized customer-oriented niche; (f) general and administrative expenses; and
(g) expenses related to the national management of the Rogers Video stores.
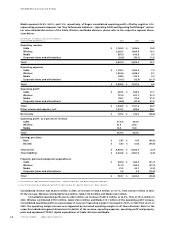
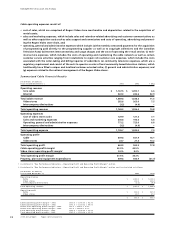
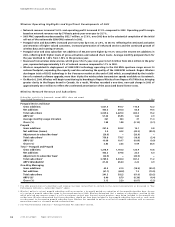
Summarized Cable Financial Results
(In millions of dollars)
Years Ended December 31, 2003 2002 % Chg
Operating revenue
Core cable $ 1,167.5 $ 1,095.7 6.6
Internet 322.3 242.6 32.9
Total cable revenue 1,489.8 1,338.3 11.3
Video stores 282.6 263.0 7.5
Intercompany eliminations (3.2) (4.9) –
Total operating revenue 1,769.2 1,596.4 10.8
Operating expenses
Cost of video stores sales 129.9 121.3 7.1
Sales and marketing expenses 206.8 193.6 6.8
Operating, general and administrative expenses 772.2 723.0 6.8
Intercompany eliminations (3.2) (4.9) –
Total operating expense 1,105.7 1,033.0 7.0
Operating profit1
Cable 639.8 541.9 18.1
Video stores 23.7 21.5 10.2
Total operating profit 663.5 563.5 17.8
Cable operating profit margin242.9% 40.5%
Video stores operating profit margin18.4% 8.2%
Total operating profit margin 37.5% 35.3%
Property, plant and equipment expenditures 509.6 650.9 (21.7)
1 As defined in “Key Performance Indicators – Operating Profit and Operating Profit Margin” section.
2 As defined in “Key Performance Indicators – Operating Profit and Operating Profit Margin” section and is calculated as follows:
(In millions of dollars)
Year Ended December 31, 2003 2002
Operating revenue
Cable $ 1,489.8 $ 1,338.3
Video stores 282.6 263.0
Intercompany eliminations (3.2) (4.9)
Total operating revenue $ 1,769.2 $ 1,596.4
Operating profit
Cable $ 639.8 $ 541.9
Video stores 23.7 21.5
$ 663.5 $ 563.5
Cable operating profit margin – 2003 $639.8 ÷ $1,489.8 = 42.9%
Cable operating profit margin – 2002 $541.9 ÷ $1,338.3 = 40.5%
Video store operating profit margin – 2003 $23.7 ÷ $282.6 = 8.4%
Video store operating profit margin – 2002 $21.5 ÷ $263.0 = 8.2%
Total operating profit margin – 2003 $663.5 ÷ $1,769.2 = 37.5%
Total operating profit margin – 2002 $563.5 ÷ $1,596.4 = 35.3%
Management’s Discussion and Analysis