Rogers 2003 Annual Report Download - page 48
Download and view the complete annual report
Please find page 48 of the 2003 Rogers annual report below. You can navigate through the pages in the report by either clicking on the pages listed below, or by using the keyword search tool below to find specific information within the annual report.-
 1
1 -
2
-
3
-
4
-
5
-
6
-
7
-
8
-
9
-
10
-
11
-
12
-
13
-
14
-
15
-
16
-
17
-
18
-
19
-
20
-
21
-
22
-
23
-
24
-
25
-
26
-
27
-
28
-
29
-
30
-
31
-
32
-
33
-
34
-
35
-
36
-
37
-
 38
38 -
 39
39 -
 40
40 -
 41
41 -
 42
42 -
 43
43 -
 44
44 -
 45
45 -
 46
46 -
 47
47 -
 48
48 -
 49
49 -
 50
50 -
 51
51 -
 52
52 -
 53
53 -
 54
54 -
 55
55 -
 56
56 -
 57
57 -
 58
58 -
59
-
60
-
61
-
62
-
63
-
64
-
65
-
66
-
67
-
68
-
69
-
70
-
71
-
72
-
73
-
74
-
75
-
76
-
77
-
78
-
79
-
80
-
81
-
82
-
83
-
84
-
85
-
86
-
87
-
88
-
89
-
90
-
91
-
92
-
93
-
94
-
95
-
96
-
97
-
98
-
99
-
100
-
101
-
102
-
103
-
104
-
105
-
106
-
107
-
108
-
109
-
110
-
111
-
112
 |
 |

2003 Annual Report Rogers Communications Inc.
46
Wireless Operating Highlights and Significant Developments of 2003
• Network revenue increased 16.0% and operating profit increased 37.9% compared to 2002. Operating profit margin
based on network revenue rose by 570 basis points year-over-year to 35.7%.
• 2003 PP&E expenditures decreased by $152.7 million, or 27.0%, over 2002 due to the substantial completion of the initial
roll-out of the nationwide GSM/GPRS network in 2002.
• Postpaid voice and data ARPU increased year-over-year by $1.60, or 2.9%, to $57.55, reflecting the continued activation
and retention of higher valued customers, increased penetration of enhanced services and the continued growth of
wireless data and roaming revenues.
• Postpaid voice and data subscriber net additions of 400,200 were higher by 19.3% versus the 335,400 net additions in
2002, reflecting both higher levels of gross activations and reduced churn levels. Average monthly postpaid churn for
the year declined to 1.88% from 1.98% in the previous year.
• Revenues from wireless data services, which grew 125.0% year-over-year to $67.9 million from $30.2 million in the prior
year, represented approximately 3.3% of network revenue compared to 1.7% in 2002.
• Wireless completed its deployment of GSM/GPRS technology operating in the 850 MHz spectrum range across its
national footprint, expanding the capacity and also enhancing the quality of the GSM/GPRS network. Rogers Wireless
also began trials of EDGE technology in the Vancouver market at the end of 2003 which, accomplished by the installa-
tion of a network software upgrade, more than triples the wireless data transmission speeds available on its network.
• On March 8, 2004, Wireless will begin transitioning its branding to Rogers Wireless from Rogers AT&T Wireless, bringing
greater clarity to the Rogers brand in Canada. As a result, Wireless recorded a one-time, non-cash charge in 2003 of
approximately $20.0 million to reflect the accelerated amortization of the associated brand licence costs.
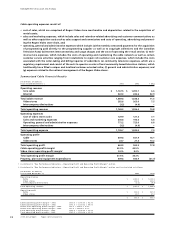
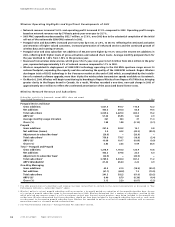
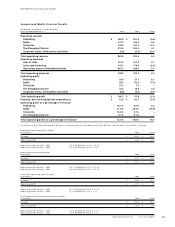
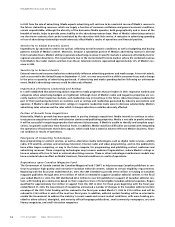
Wireless Network Revenue and Subscribers
(Subscriber statistics in thousands, except ARPU, churn and usage)
Years Ended December 31, 2003 2002 Chg % Chg
Postpaid (Voice and Data)1
Gross additions 1,021.5 910.7 110.8 12.2
Net additions 400.2 335.4 64.8 19.3
Total subscribers 3,029.6 2,629.3 400.3 15.2
ARPU ($)357.55 55.95 1.60 2.9
Average monthly usage (minutes) 361 324 37 11.4
Churn (%) 1.88 1.98 (0.10) (5.1)
Prepaid
Gross additions 257.4 243.3 14.1 5.8
Net additions (losses) 2.0 44.2 (42.2) (95.5)
Adjustment to subscriber base2(20.9) – (20.9) –
Total subscribers2759.8 778.7 (18.9) (2.4)
ARPU ($)310.08 10.17 (0.09) (0.9)
Churn (%) 2.82 2.23 0.59 26.5
Total – Postpaid and Prepaid
Gross additions 1,278.9 1,154.0 124.9 10.8
Net additions 402.2 379.6 22.6 6.0
Adjustment to subscriber base2(20.9) – (20.9) –
Total subscribers23,789.4 3,408.0 381.4 11.2
ARPU (blended)($)347.42 45.20 2.22 4.9
One-Way Messaging
Gross additions 42.5 61.0 (18.5) (30.3)
Net additions (61.1) (68.3) 7.2 (10.5)
Total subscribers 241.3 302.3 (61.0) (20.2)
ARPU ($)38.40 8.79 (0.39) (4.4)
Churn (%) 3.13 3.20 (0.07) (2.2)
1 The 2002 presentation of subscribers and revenue has been reclassified to conform to the current presentation as discussed in “Key
Performance Indicators – Subscriber Counts” above.
2 Wireless’ policy is to treat prepaid subscribers with no usage for a six month period as a reduction of the prepaid subscriber base. As part
of a review of prepaid subscriber usage in the second quarter of 2003, Wireless determined that a number of subscribers, totaling 20,900,
which only had non-revenue usage (i.e. calls to customer service) over the past several quarters, were being included in the prepaid sub-
scriber base. Wireless determined that these subscribers should not have been included in the prepaid subscriber base and, as such, made
an adjustment to the opening prepaid subscriber base. Wireless has amended its policy to reflect all prepaid subscribers with no revenue-
generating usage in a six month period as deactivations.
3 See “Key Performance Indicators – Average Revenue Per Subscriber” section.
Management’s Discussion and Analysis