Rogers 2003 Annual Report Download - page 31
Download and view the complete annual report
Please find page 31 of the 2003 Rogers annual report below. You can navigate through the pages in the report by either clicking on the pages listed below, or by using the keyword search tool below to find specific information within the annual report.-
 1
1 -
2
-
3
-
4
-
5
-
6
-
7
-
8
-
9
-
10
-
11
-
12
-
13
-
14
-
15
-
16
-
17
-
18
-
19
-
20
-
 21
21 -
 22
22 -
 23
23 -
 24
24 -
 25
25 -
 26
26 -
 27
27 -
 28
28 -
 29
29 -
 30
30 -
 31
31 -
 32
32 -
 33
33 -
 34
34 -
 35
35 -
 36
36 -
 37
37 -
 38
38 -
 39
39 -
 40
40 -
 41
41 -
42
-
43
-
44
-
45
-
46
-
47
-
48
-
49
-
50
-
51
-
52
-
53
-
54
-
55
-
56
-
57
-
58
-
59
-
60
-
61
-
62
-
63
-
64
-
65
-
66
-
67
-
68
-
69
-
70
-
71
-
72
-
73
-
74
-
75
-
76
-
77
-
78
-
79
-
80
-
81
-
82
-
83
-
84
-
85
-
86
-
87
-
88
-
89
-
90
-
91
-
92
-
93
-
94
-
95
-
96
-
97
-
98
-
99
-
100
-
101
-
102
-
103
-
104
-
105
-
106
-
107
-
108
-
109
-
110
-
111
-
112
 |
 |

2003 Annual ReportRogers Communications Inc. 29
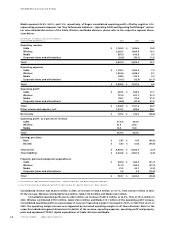
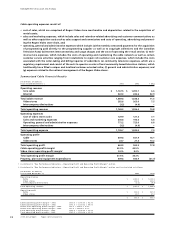
On a consolidated basis, the Company recorded net income of $129.2 million for the year ended December 31, 2003,
as compared to net income of $312.0 million in 2002. Refer to “Reconciliation of Operating Profit to Net Income” and
“Liquidity and Capital Resources” below for additional discussion of the year-over-year changes in net income.
Reconciliation of Operating Profit to Net Income
The items listed below represent the consolidated income and expense amounts that are required to reconcile operating
profit with operating income and net income as defined under Canadian GAAP. The following section should be read in
conjunction with Note 16 to the Consolidated Financial Statements for details of these amounts on a segment-by-segment
basis and an understanding of intersegment eliminations on consolidation.
(In millions of dollars)
Years Ended December 31, 2003 2002
Operating profit1$ 1,448.9 $ 1,141.6
Other2–6.5
Depreciation and amortization (1,040.3) (981.5)
Operating income 408.6 166.6
Interest on long-term debt (488.9) (491.3)
Losses from investments accounted for by the equity method (54.0) (100.6)
Foreign exchange gain 303.7 6.2
Gain (loss) on repayment of long-term debt (24.8) 10.1
Gain (loss) on sale of other investments 17.9 (0.6)
Write-down of investments – (301.0)
Gain on disposition of AT&T Canada Deposit Receipts – 904.3
Other income 2.2 2.4
Income taxes 22.9 74.7
Non-controlling interest (58.4) 41.2
Net income $ 129.2 $ 312.0
1 As previously defined see “Key Performance Indicators – Operating Profit and Operating Profit Margin”.
2Other
In 2002, a net recovery of $6.5 million was recorded consisting of the following items:
(In millions of dollars)
Workforce reduction costs – Cable $ (5.9)
Change in estimate of sales tax – Wireless 19.2
CRTC contribution liabilities – Wireless (6.8)
$6.5
Cable Workforce Reduction Costs
During the fourth quarter of 2002, Cable reduced its workforce by 187 employees in the technical service, network opera-
tions and engineering departments and incurred $5.9 million in costs, primarily related to severance and other
termination benefits, associated with this reduction. In addition to these employee separations, Cable eliminated approx-
imately 62 contract positions. Of this amount, $1.9 million was paid in fiscal 2002, with the balance of $4.0 million being
paid in fiscal 2003.
Wireless Change in the Estimate of Sales Tax
In 2002, Wireless received clarification with respect to a potential sales tax liability that the Company had recorded as an
expense in previous periods. As a result, Wireless released a $19.2 million provision related to previous years’ operations.
Wireless CRTC Contribution Liabilities
In 2002, Wireless received additional information with respect to the calculation of the CRTC contributions and more
specifically, the applicability of the contribution levy on certain revenues. As a result of this information, the Company
determined and recorded an additional expense related to 2001 in the amount of $6.8 million. The CRTC contribution
regime is discussed in the “Overview of Government Regulation and Regulatory Developments” section below.
Depreciation and Amortization Expense
Depreciation and amortization expense in 2003 was $1,040.3 million, an increase of $58.8 million, or 6.0%, from $981.5 mil-
lion in the prior year. The increase was directly attributable to increased PP&E expenditures and the resultant higher asset
levels at Cable and Wireless associated with PP&E spending over the past several years. With the reduction of PP&E expen-
ditures in 2002 and 2003 from 2001 levels, however, the increases in depreciation are less significant than in previous years.
Management’s Discussion and Analysis