Rogers 2003 Annual Report Download - page 55
Download and view the complete annual report
Please find page 55 of the 2003 Rogers annual report below. You can navigate through the pages in the report by either clicking on the pages listed below, or by using the keyword search tool below to find specific information within the annual report.-
 1
1 -
2
-
3
-
4
-
5
-
6
-
7
-
8
-
9
-
10
-
11
-
12
-
13
-
14
-
15
-
16
-
17
-
18
-
19
-
20
-
21
-
22
-
23
-
24
-
25
-
26
-
27
-
28
-
29
-
30
-
31
-
32
-
33
-
34
-
35
-
36
-
37
-
38
-
39
-
40
-
41
-
42
-
43
-
44
-
 45
45 -
 46
46 -
 47
47 -
 48
48 -
 49
49 -
 50
50 -
 51
51 -
 52
52 -
 53
53 -
 54
54 -
 55
55 -
 56
56 -
 57
57 -
 58
58 -
 59
59 -
 60
60 -
 61
61 -
 62
62 -
 63
63 -
 64
64 -
 65
65 -
66
-
67
-
68
-
69
-
70
-
71
-
72
-
73
-
74
-
75
-
76
-
77
-
78
-
79
-
80
-
81
-
82
-
83
-
84
-
85
-
86
-
87
-
88
-
89
-
90
-
91
-
92
-
93
-
94
-
95
-
96
-
97
-
98
-
99
-
100
-
101
-
102
-
103
-
104
-
105
-
106
-
107
-
108
-
109
-
110
-
111
-
112
 |
 |

2003 Annual ReportRogers Communications Inc. 53
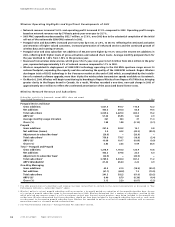
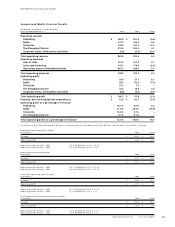
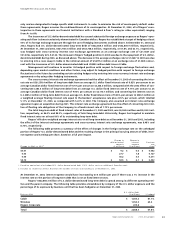
Summarized Media Financial Results
(In millions of dollars, except margins)
Years Ended December 31, 2003 2002 % Chg
Operating revenue
Publishing $ 289.9 $ 291.6 (0.6)
Radio 177.2 166.2 6.6
Television 178.0 151.3 17.6
The Shopping Channel 210.5 202.2 4.1
Corporate items, eliminations and other (0.6) (0.5) 20.0
Total operating revenue 855.0 810.8 5.5
Operating expenses
Cost of sales 131.5 127.6 3.1
Sales and marketing 175.7 176.6 (0.5)
Operating, general and administrative 441.1 419.0 5.3
Total operating expenses 748.3 723.2 3.5
Operating profit1
Publishing 29.4 27.7 6.1
Radio 38.7 42.0 (7.9)
Television 27.7 7.7 –
The Shopping Channel 19.2 18.4 4.4
Corporate items, eliminations and other (8.3) (8.2) (0.1)
Total operating profit $ 106.7 $ 87.6 21.8
Property, plant and equipment expenditures $ 41.3 $ 42.7 (3.3)
Operating profit as a percentage of revenue1
Publishing 10.1% 9.5% 6.3
Radio 21.8% 25.3% (13.8)
Television 15.6% 5.1% –
The Shopping Channel 9.1% 9.1% –
Total operating profit as a percentage of revenue112.5% 10.8% 15.7
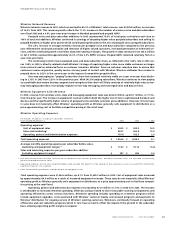
1 As defined in the “Key Performance Indicators – Operating Profit and Operating Profit Margin” section and is calculated as follows:
Publishing operating profit margin:
($ millions) 2003 2002
Revenue $ 289.9 $ 291.6
Operating profit $ 29.4 $ 27.7
Operating profit margin – 2003 $29.4 divided by $289.9 = 10.1%
Operating profit margin – 2002 $27.7 divided by $291.6 = 9.5%
Radio operating profit margin:
($ millions) 2003 2002
Revenue $ 177.2 $ 166.2
Operating profit $ 38.7 $ 42.0
Operating profit margin – 2003 $38.7 divided by $177.2 = 21.8%
Operating profit margin – 2002 $42.0 divided by $166.2 = 25.3%
Television operating profit margin:
($ millions) 2003 2002
Revenue $ 178.0 $ 151.3
Operating profit $ 27.7 $ 7.7
Operating profit margin – 2003 $27.7 divided by $178.0 = 15.6%
Operating profit margin – 2002 $7.7 divided by $151.3 = 5.1%
The Shopping Channel operating profit margin:
($ millions) 2003 2002
Revenue $ 210.5 $ 202.2
Operating profit $ 19.2 $ 18.4
Operating profit margin – 2003 $19.2 divided by $210.5 = 9.1%
Operating profit margin – 2002 $18.4 divided by $202.2 = 9.1%
Management’s Discussion and Analysis