Reebok 2007 Annual Report Download - page 97
Download and view the complete annual report
Please find page 97 of the 2007 Reebok annual report below. You can navigate through the pages in the report by either clicking on the pages listed below, or by using the keyword search tool below to find specific information within the annual report.-
 1
1 -
2
-
3
-
4
-
5
-
6
-
7
-
8
-
9
-
10
-
11
-
12
-
13
-
14
-
15
-
16
-
17
-
18
-
19
-
20
-
21
-
22
-
23
-
24
-
25
-
26
-
27
-
28
-
29
-
30
-
31
-
32
-
33
-
34
-
35
-
36
-
37
-
38
-
39
-
40
-
41
-
42
-
43
-
44
-
45
-
46
-
47
-
48
-
49
-
50
-
51
-
52
-
53
-
54
-
55
-
56
-
57
-
58
-
59
-
60
-
61
-
62
-
63
-
64
-
65
-
66
-
67
-
68
-
69
-
70
-
71
-
72
-
73
-
74
-
75
-
76
-
77
-
78
-
79
-
80
-
81
-
82
-
83
-
84
-
85
-
86
-
 87
87 -
 88
88 -
 89
89 -
 90
90 -
 91
91 -
 92
92 -
 93
93 -
 94
94 -
 95
95 -
 96
96 -
 97
97 -
 98
98 -
 99
99 -
 100
100 -
 101
101 -
 102
102 -
 103
103 -
 104
104 -
 105
105 -
 106
106 -
 107
107 -
108
-
109
-
110
-
111
-
112
-
113
-
114
-
115
-
116
-
117
-
118
-
119
-
120
-
121
-
122
-
123
-
124
-
125
-
126
-
127
-
128
-
129
-
130
-
131
-
132
-
133
-
134
-
135
-
136
-
137
-
138
-
139
-
140
-
141
-
142
-
143
-
144
-
145
-
146
-
147
-
148
-
149
-
150
-
151
-
152
-
153
-
154
-
155
-
156
-
157
-
158
-
159
-
160
-
161
-
162
-
163
-
164
-
165
-
166
-
167
-
168
-
169
-
170
-
171
-
172
-
173
-
174
-
175
-
176
-
177
-
178
-
179
-
180
-
181
-
182
-
183
-
184
-
185
-
186
-
187
-
188
-
189
-
190
-
191
-
192
-
193
-
194
-
195
-
196
-
197
-
198
-
199
-
200
-
201
-
202
-
203
-
204
-
205
-
206
-
207
-
208
-
209
-
210
-
211
-
212
-
213
-
214
-
215
-
216
 |
 |
093
ANNUAL REPORT 2007 --- adidas Group
03
NET DEBT POSITION REDUCED BY NEARLY € 500 MILLION
Net borrowings at December 31, 2007 amounted to
€ 1.766 billion, which represents a reduction of € 465 million,
or 21%, versus € 2.231 billion in the prior year. This improve-
ment was signifi cantly better than our original target of
below € 2 billion as communicated at the beginning of 2007.
see Internal Group Management System, p. 056 The Group’s strong profi t-
ability improvement and continued tight working capital
management were the primary drivers of this decline. In addi-
tion, positive currency effects contributed € 98 million to
the net borrowings improvement. Consequently, the Group’s
fi nancial leverage also improved signifi cantly to 58.4 % at the
end of 2007 versus 78.9 % in the prior year. On a net debt basis,
the utilization of the available credit facilities for the Group at
the end of 2007 was 28 % versus 32 % in the prior year.
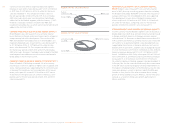
CURRENCY MANAGEMENT FURTHER OPTIMIZED Due to the
Group’s global activity, currency management is a key focus of
the Group’s central Treasury department. Hedging US dollars is
the central pillar of our program. This is a direct result of our
Asian-dominated sourcing, which is largely denominated in US
dollars. see Global Operations, p. 062 In 2007, the central Treasury
department managed a net defi cit of around US $ 1.5 billion
against the euro. This represents a decrease of approximately
US $ 200 million from around US $ 1.7 billion in the prior year,
mainly as a result of the non-recurrence of a one-time effect
related to the Reebok acquisition in 2006. As outlined in our
Group’s Treasury Policy, we have established a rolling 12 to
18 months hedging system, under which a large amount of the
anticipated seasonal hedging volume is secured six months
prior to the start of a season. As a result, we have already com-
pleted around 70 % of our anticipated hedging needs for 2008
at higher rates than those of 2007 and we have already started
to hedge our exposure for 2009. The use or combination
of different hedging instruments, such as cur rency options,
swaps and forward contracts, protects us against unfavorable
currency movements, while retaining the potential to benefi t
from future favorable exchange rate developments.
see Risk and Opportunity Report, p. 104
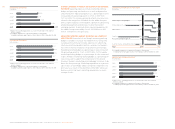
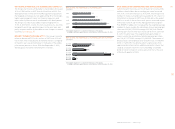
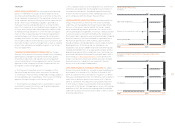
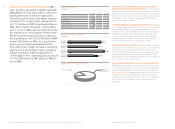
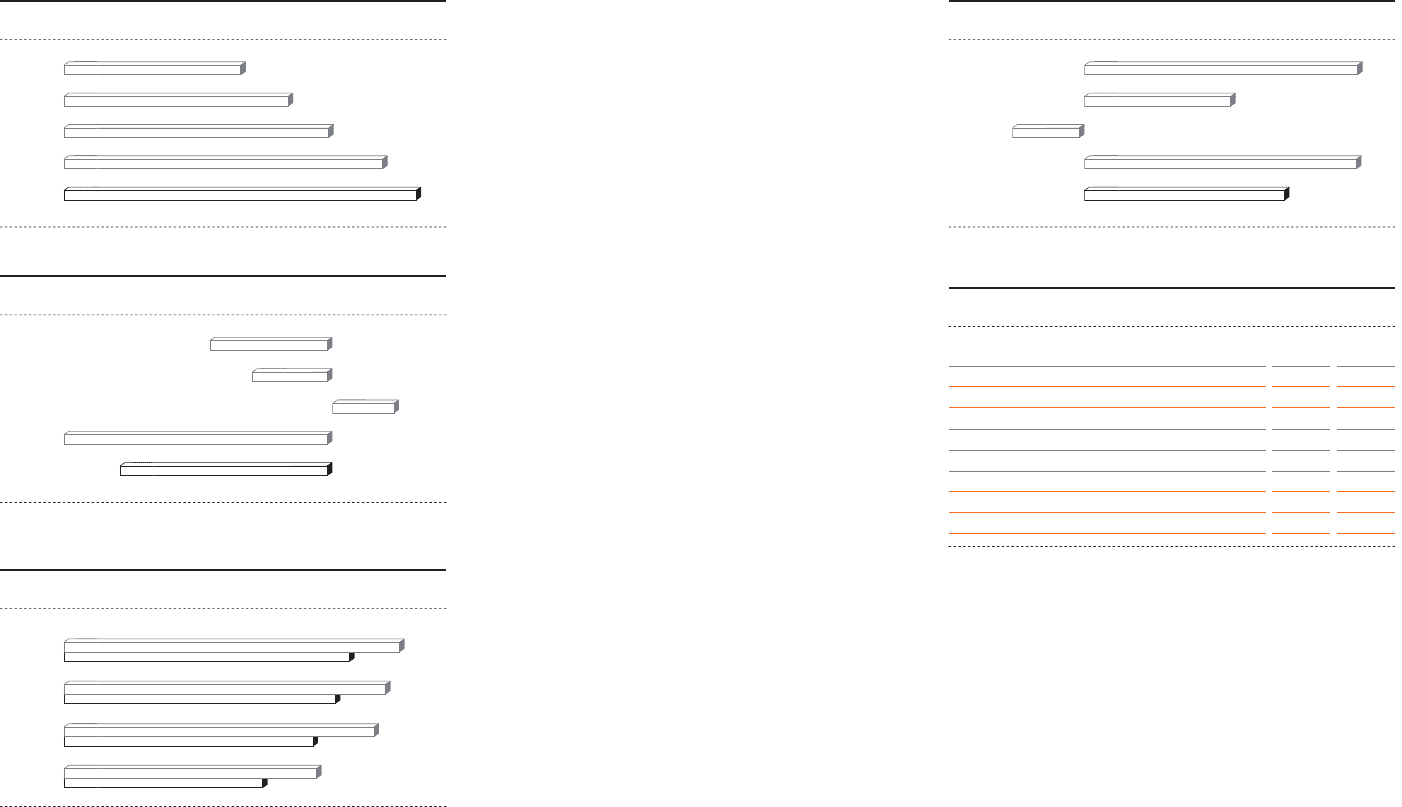
FINANCING STRUCTURE 1)
€ in millions
2
007
7
2006
T
otal cash and short-term fi nancial assets
Bank borrowings
Commercial paper
Private placements
Convertible bond
G
ross total borrowings
N
et cash / (Net borrowin
g
s) 1
)
1)
Roundin
g
differences may arise in totals.
381 347
7
198
275
0
144
1,564 1,784
4
3
8
4
375
2,146 2,578
(1,766) (2,231
)
)
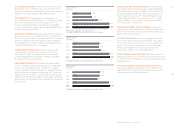
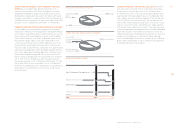
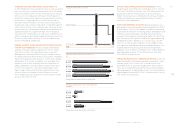
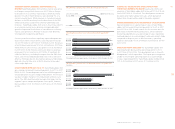
NET CASH / (NET BORROWINGS)
€
in million
s
2003 1)
2004 1)
2005
2006 2)
2
007
1) Restated due to a
pp
lication of amendment to IAS 39
.
2
)
Includin
g
Reebok business se
g
ment from February 1, 2006 onwards
.
(665)
551
(2,231)
(1,766)
(1,018)
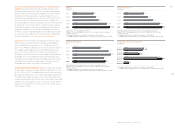
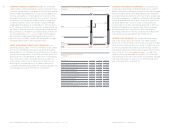
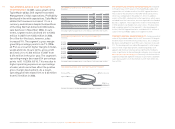
INTEREST RATE DEVELOPMENT 1)
i
n
%
2003
2004
2005
2006
2007
1
)
Wei
g
hted avera
g
e interest rate of
g
ross borrowin
g
s
.
3.4
4.0
4.8
5
.
3
2.7
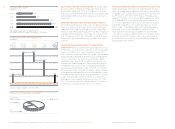
FINANCIAL LEVERAGE
i
n
%
2003 1)
2004 1)
2005
2006 2)
200
7
1)
Restated due to application of IAS 32/IAS 39 and amendment to IAS 19
.
2)
Including Reebok business segment from February 1, 2006 onwards.
43.1
(20.5)
78.9
58.4
79.2
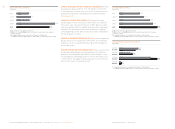
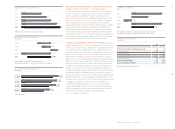
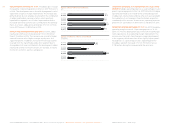
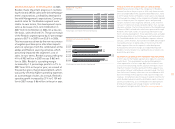
NET BORROWINGS BY QUARTER 1)
€
in milli
o
n
s
Q1 2006
Q
1
200
7
Q2 2006
Q
2 2007
Q3 2006
Q
3
2007
Q4 2006
Q
4
200
7
1
)
At end of period.
2
,
20
1
2,728
2,
395
2,829
2
,51
9
2,952
1,766
2,231