Reebok 2007 Annual Report Download - page 86
Download and view the complete annual report
Please find page 86 of the 2007 Reebok annual report below. You can navigate through the pages in the report by either clicking on the pages listed below, or by using the keyword search tool below to find specific information within the annual report.-
 1
1 -
2
-
3
-
4
-
5
-
6
-
7
-
8
-
9
-
10
-
11
-
12
-
13
-
14
-
15
-
16
-
17
-
18
-
19
-
20
-
21
-
22
-
23
-
24
-
25
-
26
-
27
-
28
-
29
-
30
-
31
-
32
-
33
-
34
-
35
-
36
-
37
-
38
-
39
-
40
-
41
-
42
-
43
-
44
-
45
-
46
-
47
-
48
-
49
-
50
-
51
-
52
-
53
-
54
-
55
-
56
-
57
-
58
-
59
-
60
-
61
-
62
-
63
-
64
-
65
-
66
-
67
-
68
-
69
-
70
-
71
-
72
-
73
-
74
-
75
-
 76
76 -
 77
77 -
 78
78 -
 79
79 -
 80
80 -
 81
81 -
 82
82 -
 83
83 -
 84
84 -
 85
85 -
 86
86 -
 87
87 -
 88
88 -
 89
89 -
 90
90 -
 91
91 -
 92
92 -
 93
93 -
 94
94 -
 95
95 -
 96
96 -
97
-
98
-
99
-
100
-
101
-
102
-
103
-
104
-
105
-
106
-
107
-
108
-
109
-
110
-
111
-
112
-
113
-
114
-
115
-
116
-
117
-
118
-
119
-
120
-
121
-
122
-
123
-
124
-
125
-
126
-
127
-
128
-
129
-
130
-
131
-
132
-
133
-
134
-
135
-
136
-
137
-
138
-
139
-
140
-
141
-
142
-
143
-
144
-
145
-
146
-
147
-
148
-
149
-
150
-
151
-
152
-
153
-
154
-
155
-
156
-
157
-
158
-
159
-
160
-
161
-
162
-
163
-
164
-
165
-
166
-
167
-
168
-
169
-
170
-
171
-
172
-
173
-
174
-
175
-
176
-
177
-
178
-
179
-
180
-
181
-
182
-
183
-
184
-
185
-
186
-
187
-
188
-
189
-
190
-
191
-
192
-
193
-
194
-
195
-
196
-
197
-
198
-
199
-
200
-
201
-
202
-
203
-
204
-
205
-
206
-
207
-
208
-
209
-
210
-
211
-
212
-
213
-
214
-
215
-
216
 |
 |
082
ANNUAL REPORT 2007 --- adidas Group GROUP MANAGEMENT REPORT – OUR FINANCIAL YEAR -- Group Business Performance - Income Statement
COST OF SALES DECLINES 3 % Cost of sales is defi ned as the
amount we pay to third parties for expenses associated with
producing and delivering our products. Own-production expenses
at adidas and Reebok as well as assembling expenses at
TaylorMade-adidas Golf are also included in the Group’s cost
of sales. However, these expenses represent only a very
small portion of total cost of sales. In 2007, cost of sales was
€ 5.417 billion, representing a decrease of 3 % from € 5.589 bil-
lion in 2006, despite higher sourcing volumes compared to the
prior year. This improvement is the result of cost synergies from
the combination of adidas and Reebok sourcing activities. The
optimization of sourcing processes and effi ciency gains within
our supply chain more than offset in creasing labor and raw
material costs.
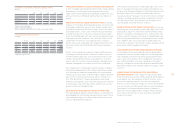
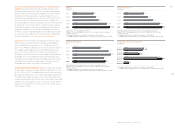
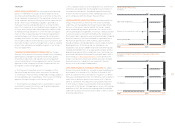
SALES INCREASE IN NEARLY ALL REGIONS adidas Group sales
grew in all regions except North America in 2007. Group sales
in Europe grew 7 % on a currency-neutral basis as a result
of strong growth in the region’s emerging markets. In North
America, Group sales declined 2 % on a currency- neutral basis
due to lower Reebok sales in the USA. Sales for the adidas
Group in Asia increased 18 % on a currency-neutral basis,
driven by growth in China. In Latin America, sales grew 38 %
on a currency-neutral basis, with increases coming from all
of the region’s major markets.
Currency translation effects negatively impacted sales in euro
terms in all regions. In euro terms, sales in Europe increased
5 % to € 4.369 billion in 2007 from € 4.162 billion in 2006. Sales
in North America decreased 9 % to € 2.929 billion in 2007
from € 3.234 billion in the prior year. Revenues in Asia grew
12 % to € 2.254 billion in 2007 from € 2.020 billion in 2006.
Sales in Latin America grew 32 % to € 657 million in 2007
from € 499 million in the prior year.
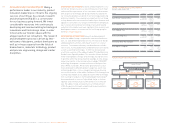
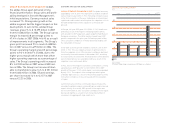
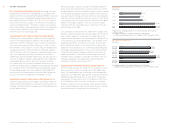
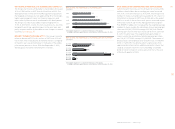
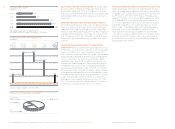
GROUP APPAREL SALES GROW STRONGLY From a product
category perspective, Group sales growth in the year was
largely driven by the apparel category. Currency-neutral foot-
wear sales grew solidly and increased 5 % during the period.
Strong in creases in the adidas and TaylorMade-adidas Golf
segments were partly offset by declines in the Reebok seg-
ment. Apparel sales grew 11 % on a currency-neutral basis.
Increases in the adidas and Reebok segments were partly off-
set by a decrease at TaylorMade-adidas Golf. In this segment,
increases in adidas Golf apparel sales were more than offset
by negative impacts from the divestiture of the GNC wholesale
business. Currency-neutral hardware sales were stable com-
pared to the prior year. Increases at TaylorMade-adidas Golf
were offset by declines in the adidas and Reebok segments.
Currency translation effects negatively impacted sales in all
product categories in euro terms. As a result, footwear sales in
euros were vir tually unchanged at € 4.751 billion in 2007
(2006: € 4.733 billion). Apparel sales in euro terms grew 6 % to
€ 4.365 billion in 2007 from € 4.105 bil lion in the prior year.
Hardware sales in euros decreased 5 % to € 1.182 billion in
2007 from € 1.246 billion in 2006.
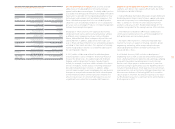
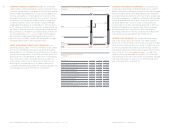
NET SALES BY PRODUCT CATEGORY
€
in millions
Footwear Apparel Hardware
To
t
al
l
2003
2004 1)
2005 1)
2006 2)
2
00
7
1) Figures refl ect continuing operations as a result of the divestiture of the Salomon
business segment.
2)
Includin
g
Reebok business se
g
ment from February 1, 2006 onwards
.
Includin
g
Gre
g
Norman apparel business from February 1, 2006 to November
3
0, 2006
.
2,767 2,222 1,278
6,
26
7
7
2,620 2,462 778 5,
8
6
0
0
2,978 2,798 860
6
,6
36
6
4,733 4,105 1,246 10
,
08
4
4
4,751 4,365 1,182 10,299
9
2
5
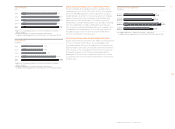
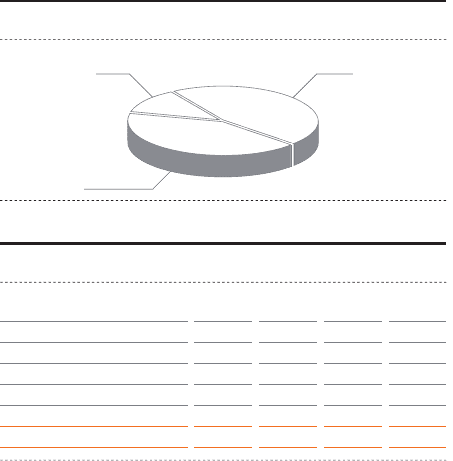
2007 NET SALES BY PRODUCT CATEGORY
Hardware 12
%
Apparel 42
%
46
%
Footwear