Reebok 2007 Annual Report Download - page 100
Download and view the complete annual report
Please find page 100 of the 2007 Reebok annual report below. You can navigate through the pages in the report by either clicking on the pages listed below, or by using the keyword search tool below to find specific information within the annual report.-
 1
1 -
2
-
3
-
4
-
5
-
6
-
7
-
8
-
9
-
10
-
11
-
12
-
13
-
14
-
15
-
16
-
17
-
18
-
19
-
20
-
21
-
22
-
23
-
24
-
25
-
26
-
27
-
28
-
29
-
30
-
31
-
32
-
33
-
34
-
35
-
36
-
37
-
38
-
39
-
40
-
41
-
42
-
43
-
44
-
45
-
46
-
47
-
48
-
49
-
50
-
51
-
52
-
53
-
54
-
55
-
56
-
57
-
58
-
59
-
60
-
61
-
62
-
63
-
64
-
65
-
66
-
67
-
68
-
69
-
70
-
71
-
72
-
73
-
74
-
75
-
76
-
77
-
78
-
79
-
80
-
81
-
82
-
83
-
84
-
85
-
86
-
87
-
88
-
89
-
 90
90 -
 91
91 -
 92
92 -
 93
93 -
 94
94 -
 95
95 -
 96
96 -
 97
97 -
 98
98 -
 99
99 -
 100
100 -
 101
101 -
 102
102 -
 103
103 -
 104
104 -
 105
105 -
 106
106 -
 107
107 -
 108
108 -
 109
109 -
 110
110 -
111
-
112
-
113
-
114
-
115
-
116
-
117
-
118
-
119
-
120
-
121
-
122
-
123
-
124
-
125
-
126
-
127
-
128
-
129
-
130
-
131
-
132
-
133
-
134
-
135
-
136
-
137
-
138
-
139
-
140
-
141
-
142
-
143
-
144
-
145
-
146
-
147
-
148
-
149
-
150
-
151
-
152
-
153
-
154
-
155
-
156
-
157
-
158
-
159
-
160
-
161
-
162
-
163
-
164
-
165
-
166
-
167
-
168
-
169
-
170
-
171
-
172
-
173
-
174
-
175
-
176
-
177
-
178
-
179
-
180
-
181
-
182
-
183
-
184
-
185
-
186
-
187
-
188
-
189
-
190
-
191
-
192
-
193
-
194
-
195
-
196
-
197
-
198
-
199
-
200
-
201
-
202
-
203
-
204
-
205
-
206
-
207
-
208
-
209
-
210
-
211
-
212
-
213
-
214
-
215
-
216
 |
 |
096
ANNUAL REPORT 2007 --- adidas Group
GROUP MANAGEMENT REPORT – OUR FINANCIAL YEAR -- Business Performance by Segment - adidas Business Performance
TRANSFER OF LICENSED BUSINESSES HAS ONLY MINOR
IMPACT ON OPERATIONAL PERFORMANCE The transfer of the
NBA and Liverpool licensed businesses from Reebok to brand
adidas in the fi rst half of 2006 had only a minor effect on sales
growth in the adidas segment. Sales related to these businesses
accounted for around one percentage point of total sales
growth in the adidas segment.
CURRENCY-NEUTRAL SEGMENT SALES GROW 12 % Revenues
for the adidas segment grew 12 % on a currency-neutral basis.
This development clearly exceeded Management’s initial
expectation of a mid-single-digit sales increase. Both apparel
and footwear revenues increased strongly. Hardware sales,
however, declined. Currency trans lation effects negatively
impacted segment revenues in euro terms. Sales grew 7 % to
€ 7.113 billion in 2007 from € 6.626 billion in 2006.
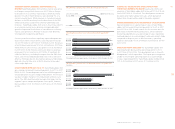
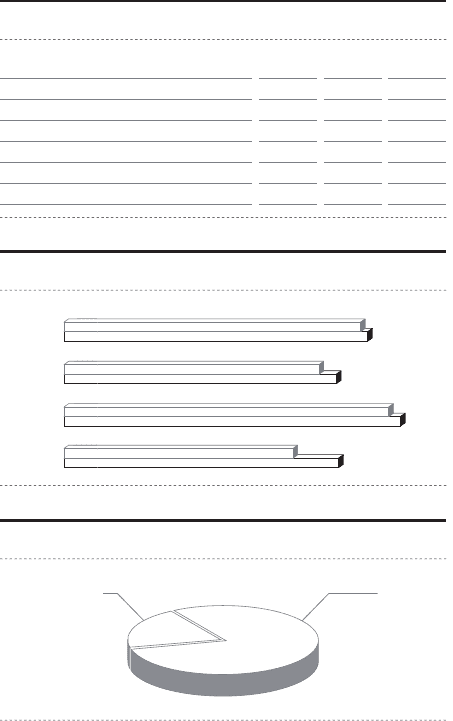
ADIDAS DIVISIONS REALIGNED During 2007, adidas realigned
its business into two divisions. see adidas Strategy, p. 046 The Sport
Performance division accounted for 80 % of adidas sales
(2006: 78 %). The Sport Style division, which merged our Sport
Heritage and Sport Style activities to sharpen brand image
and improve consumer targeting in sports lifestyle, comprised
20 % of segment sales (2006: 22 %).
SPORT PERFORMANCE UP 14 % ON A CURRENCY-NEUTRAL
BASIS Sales in the Sport Performance division increased 14 %
on a currency-neutral basis in 2007. The key categories identi-
fi ed by brand management as medium-term growth drivers
see adidas Strategy, p. 046 contributed the majority of this increase,
with particularly strong growth in the running and training
categories. In euro terms, Sport Performance sales improved
10 % in 2007 to € 5.608 billion from € 5.100 billion in the
prior year.
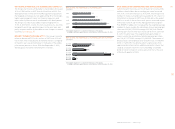
ADIDAS BUSINESS PERFORMANCE In
200
7,
s
ales
g
rowth in the adidas se
g
ment exceeded
Mana
g
ement’s initial expectations, while prof
-
i
tab
i
l
i
ty develo
p
ed
i
n l
i
ne w
i
th ex
p
ectat
i
ons.
C
urrency-neutral sales in the adidas segment
in
c
r
eased
1
2
%
.
I
n euro terms, sa
l
es grew
7
%
t
o
€
7.11
3
bi
l l
io
n
i
n
200
7 fr
o
m
€
6
.
6
2
6
bi
ll
io
n
i
n
2006
.
G
ross mar
g
in increased
1.2
percent a
g
e
p
oints to
4
7.4
%
(
2
006: 46.2
%
)
, mainl
y
driven b
y
the realization of cost synergies related to the
Reebok acquisition and own-retail expansion.
G
ross profi t
g
rew
1
0
%
t
o
€
3
.
3
70
bi
ll
io
n
i
n
200
7
f
rom €
3
.0
59
b
i
ll
i
on
i
n
2006
. As a result o
f
the
positive gross margin development, which
more than offset a sli
g
ht increase in operatin
g
expenses as a percenta
g
e of sales, operatin
g
mar
gi
n
i
ncreased 1.
0
percenta
g
e po
i
nts to
1
2.9
%
(
2006: 11.9
%
)
. Operating profi t increased
1
7
%
t
o
€
920
million in
200
7 v
ers
u
s
€
7
88
mil
-
l
i
o
n in 200
6
.
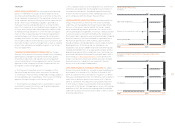
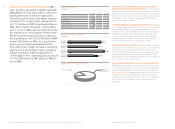
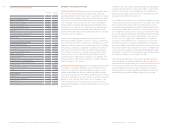
ADIDAS AT A GLANCE
€
in million
s
200
7
2006 Change
Net sales
Gross profi t
Gross margin
Operating profi t
Operating margin
7
,
11
3
3
6,626 7 %
3,37
0
0
3,059 10 %
47.4
%
%
46.2 % 1.2 pp
9
2
0
0
788 17 %
1
2.9
%
%
11.9 % 1.0 pp
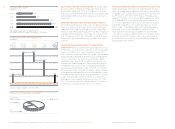
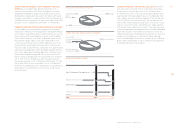
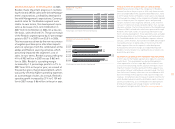
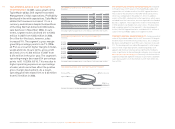
ADIDAS NET SALES BY QUARTER
€
in milli
o
n
s
Q1 2006
Q
1 2007
Q2 2006
Q2 2007
Q3 2006
Q
3
2007
Q4 2006
Q
4
200
7
2,
012
1,941
1,
63
5
1,532
1
,
8
1
9
1,776
1
,
648
1,378
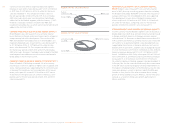
ADIDAS 2007 NET SALES BY DIVISION
Sport Style
20
%
8
0
%
Sport
Performance