Reebok 2007 Annual Report Download - page 107
Download and view the complete annual report
Please find page 107 of the 2007 Reebok annual report below. You can navigate through the pages in the report by either clicking on the pages listed below, or by using the keyword search tool below to find specific information within the annual report.-
 1
1 -
2
-
3
-
4
-
5
-
6
-
7
-
8
-
9
-
10
-
11
-
12
-
13
-
14
-
15
-
16
-
17
-
18
-
19
-
20
-
21
-
22
-
23
-
24
-
25
-
26
-
27
-
28
-
29
-
30
-
31
-
32
-
33
-
34
-
35
-
36
-
37
-
38
-
39
-
40
-
41
-
42
-
43
-
44
-
45
-
46
-
47
-
48
-
49
-
50
-
51
-
52
-
53
-
54
-
55
-
56
-
57
-
58
-
59
-
60
-
61
-
62
-
63
-
64
-
65
-
66
-
67
-
68
-
69
-
70
-
71
-
72
-
73
-
74
-
75
-
76
-
77
-
78
-
79
-
80
-
81
-
82
-
83
-
84
-
85
-
86
-
87
-
88
-
89
-
90
-
91
-
92
-
93
-
94
-
95
-
96
-
 97
97 -
 98
98 -
 99
99 -
 100
100 -
 101
101 -
 102
102 -
 103
103 -
 104
104 -
 105
105 -
 106
106 -
 107
107 -
 108
108 -
 109
109 -
 110
110 -
 111
111 -
 112
112 -
 113
113 -
 114
114 -
 115
115 -
 116
116 -
 117
117 -
118
-
119
-
120
-
121
-
122
-
123
-
124
-
125
-
126
-
127
-
128
-
129
-
130
-
131
-
132
-
133
-
134
-
135
-
136
-
137
-
138
-
139
-
140
-
141
-
142
-
143
-
144
-
145
-
146
-
147
-
148
-
149
-
150
-
151
-
152
-
153
-
154
-
155
-
156
-
157
-
158
-
159
-
160
-
161
-
162
-
163
-
164
-
165
-
166
-
167
-
168
-
169
-
170
-
171
-
172
-
173
-
174
-
175
-
176
-
177
-
178
-
179
-
180
-
181
-
182
-
183
-
184
-
185
-
186
-
187
-
188
-
189
-
190
-
191
-
192
-
193
-
194
-
195
-
196
-
197
-
198
-
199
-
200
-
201
-
202
-
203
-
204
-
205
-
206
-
207
-
208
-
209
-
210
-
211
-
212
-
213
-
214
-
215
-
216
 |
 |
103
ANNUAL REPORT 2007 --- adidas Group
03
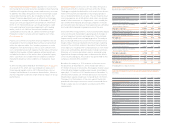
CURRENCY-NEUTRAL REVENUES GROW IN NEARLY ALL
REGIONS TaylorMade-adidas Golf currency-neutral sales grew
in all regions except North America in 2007. Sales in Europe
increased 5 % on a currency-neutral basis, driven by strong
growth in the UK. In North America, sales declined 9 % on a
currency-neutral basis. While revenues in Canada increased,
declines in the USA resulting from the divestiture of the GNC
wholesale business could not be offset by underlying sales
increases. TaylorMade-adidas Golf sales in Asia increased 20 %
on a currency-neutral basis, driven by strong double-digit
growth in Japan and South Korea. In Latin America, currency-
neutral sales grew 32 %. Revenue increases were driven by
strong growth in Argentina and Mexico.
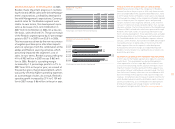
Currency translation effects negatively impacted segment rev-
enues in euro terms. In euro terms, sales in Europe increased
3 % to € 95 million in 2007 from € 92 million in 2006. Revenues
in North America decreased 16 % to € 422 million in 2007 from
€ 505 million in 2006. In Asia, sales grew 11 % to € 282 million
in 2007 (2006: € 254 million), and in Latin America revenues
increased 20 % to € 6 million in 2007 (2006: € 5 million). On
a like-for-like basis, excluding the impact from the GNC dives-
titure, sales increased by double-digit rates in Asia and Latin
America. In Europe, like-for-like revenues grew at a high-single-
digit rate. Like-for-like sales in North America increased at
a low-single-digit rate.
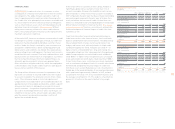
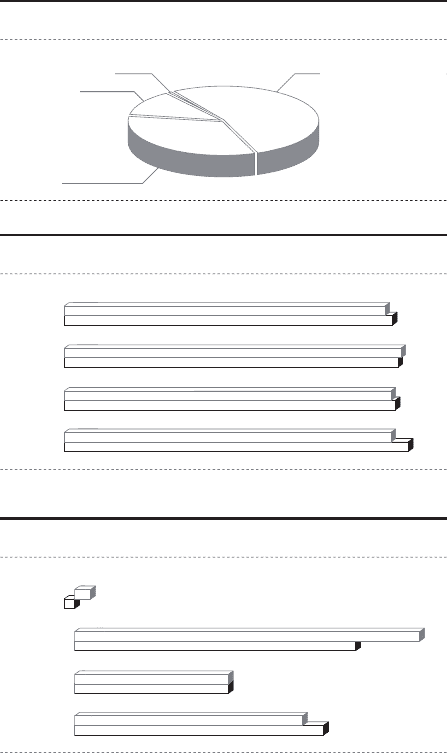
GROSS MARGIN INCREASES TO 44.7 % TaylorMade-adidas Golf
gross margin increased 0.8 percentage points to 44.7 % in 2007
(2006: 43.9 %). This development was in line with Management’s
initial expectation of a gross margin improvement. The increase
was due to higher margins in the metalwoods and irons cate-
gories. The GNC divestiture also had a positive impact on the
segment’s gross margin development. Gross profi t, however,
decreased by 4 % to € 360 million in 2007 versus € 376 million
in 2006.
ADIDAS GOLF SALES GROWTH DRIVES ROYALTY AND
COMMIS SION EXPENSE INCREASE Royalty and commission
expenses at TaylorMade-adidas Golf increased 10 % to € 18 mil-
lion in 2007 (2006: € 16 million). This development was driven
by signifi cantly higher adidas Golf sales, which generated
higher intra-Group royalties paid to the adidas segment.
OPERATING EXPENSES AS A PERCENTAGE OF SALES INCREASE
Operating expenses as a percentage of sales at TaylorMade-
adidas Golf increased 0.9 percentage points to 34.4 % in 2007
from 33.5 % in 2006. A main reason for this increase was the
divestiture of the GNC wholesale business, which had lower
marketing expenditures as a percentage of sales. Operating
overhead expenses as a percentage of sales were almost stable
compared to the prior year. In absolute terms, operating
expenses decreased 3 % to € 277 million in 2007 from € 287 mil-
lion in 2006.
OPERATING PROFIT DECLINES The TaylorMade-adidas Golf
operating margin decreased 0.4 percentage points to 8.1 %
in 2007 from 8.5 % in 2006. This development was in line with
Management’s initial expectation. The higher gross margin was
unable to offset higher operating expenses as a percentage
of sales. Operating profi t for TaylorMade-adidas Golf declined
10 % to € 65 million in 2007 versus € 73 million in 2006.
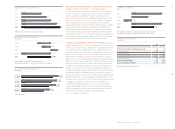
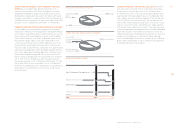
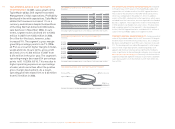
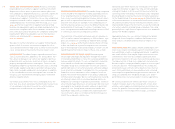
TAYLORMADE-ADIDAS GOLF GROSS MARGIN BY QUARTER 1)
in
%
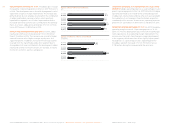
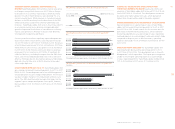
TAYLORMADE-ADIDAS GOLF OPERATING PROFIT BY QUARTER 1)
€ in million
s
Q1 2006
Q
1 200
7
Q2 2006
Q2
2007
Q3 2006
Q
3 200
7
Q4 2006
Q
4 200
7
1)
Including Greg Norman apparel business from February 1, 2006 to November 30, 2006.
Q1 2006
Q
1
2007
Q2 2006
Q2
2007
Q3 2006
Q
3 200
7
Q4 2006
Q
4
2007
1
) Including Greg Norman apparel business from February 1, 2006 to November 30, 2006.
44.
3
15
43.7
15
4
4.7
27
45.0
33
43.
9
(
1
)
42.9
2
46.
0
24
43.7
22
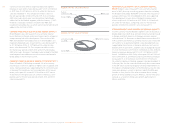
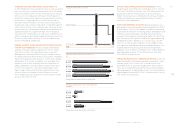
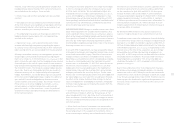
TAYLORMADE-ADIDAS GOLF 2007 NET SALES BY REGION
Latin America
1
%
Europe 12 %
Asia
3
5
%
5
2
%
North America