Reebok 2007 Annual Report Download - page 204
Download and view the complete annual report
Please find page 204 of the 2007 Reebok annual report below. You can navigate through the pages in the report by either clicking on the pages listed below, or by using the keyword search tool below to find specific information within the annual report.-
 1
1 -
2
-
3
-
4
-
5
-
6
-
7
-
8
-
9
-
10
-
11
-
12
-
13
-
14
-
15
-
16
-
17
-
18
-
19
-
20
-
21
-
22
-
23
-
24
-
25
-
26
-
27
-
28
-
29
-
30
-
31
-
32
-
33
-
34
-
35
-
36
-
37
-
38
-
39
-
40
-
41
-
42
-
43
-
44
-
45
-
46
-
47
-
48
-
49
-
50
-
51
-
52
-
53
-
54
-
55
-
56
-
57
-
58
-
59
-
60
-
61
-
62
-
63
-
64
-
65
-
66
-
67
-
68
-
69
-
70
-
71
-
72
-
73
-
74
-
75
-
76
-
77
-
78
-
79
-
80
-
81
-
82
-
83
-
84
-
85
-
86
-
87
-
88
-
89
-
90
-
91
-
92
-
93
-
94
-
95
-
96
-
97
-
98
-
99
-
100
-
101
-
102
-
103
-
104
-
105
-
106
-
107
-
108
-
109
-
110
-
111
-
112
-
113
-
114
-
115
-
116
-
117
-
118
-
119
-
120
-
121
-
122
-
123
-
124
-
125
-
126
-
127
-
128
-
129
-
130
-
131
-
132
-
133
-
134
-
135
-
136
-
137
-
138
-
139
-
140
-
141
-
142
-
143
-
144
-
145
-
146
-
147
-
148
-
149
-
150
-
151
-
152
-
153
-
154
-
155
-
156
-
157
-
158
-
159
-
160
-
161
-
162
-
163
-
164
-
165
-
166
-
167
-
168
-
169
-
170
-
171
-
172
-
173
-
174
-
175
-
176
-
177
-
178
-
179
-
180
-
181
-
182
-
183
-
184
-
185
-
186
-
187
-
188
-
189
-
190
-
191
-
192
-
193
-
 194
194 -
 195
195 -
 196
196 -
 197
197 -
 198
198 -
 199
199 -
 200
200 -
 201
201 -
 202
202 -
 203
203 -
 204
204 -
 205
205 -
 206
206 -
 207
207 -
 208
208 -
 209
209 -
 210
210 -
 211
211 -
 212
212 -
 213
213 -
 214
214 -
215
-
216
 |
 |
200
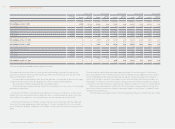
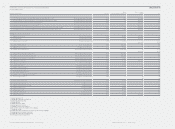
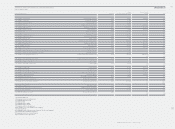
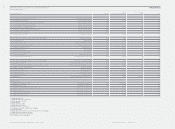
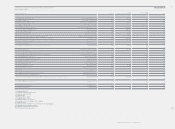
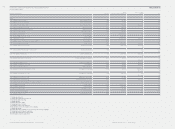
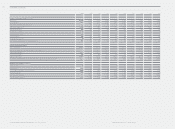
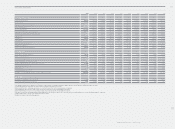
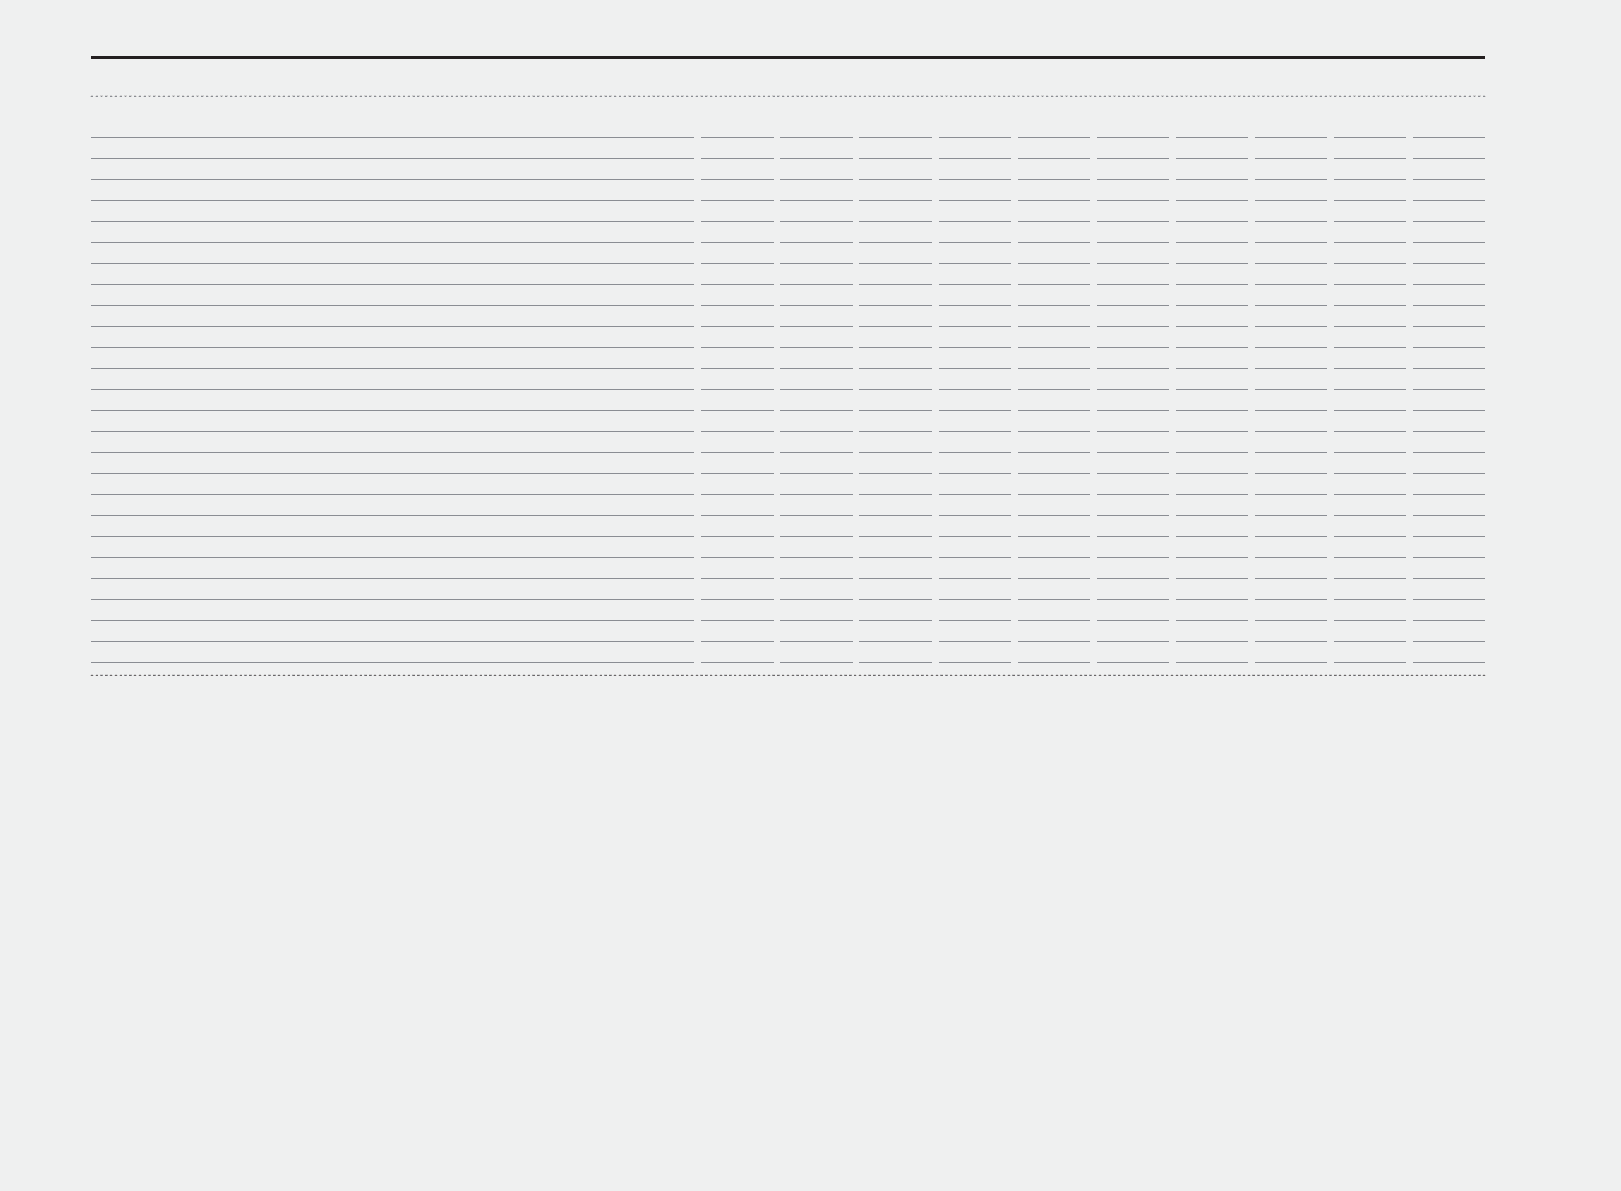
ANNUAL REPORT 2007 --- adidas Group CONSOLIDATED FINANCIAL STATEMENTS - adidas Group Segmental Information: Ten-Year Overview
200
7 2006 2005 2004 2003 2002 2001 2000 1999 1998
Brands
ad
i
da
s
Net sales
Gross profi t
Gross margin
Operating profi t 1)
Operating margin 1)
Operating assets
Reebok
2)
Net sales
Gross profi t
Gross margin
Operating profi t
Operating margin
Operating assets
T
a
y
lorMade-adidas
G
olf
3)
Net sales
Gross profi t
Gross margin
Operating profi t 1)
Operating margin 1)
Operating assets
ADIDAS GROUP SEGMENTAL INFORMATION: TEN-YEAR OVERVIEW
€
in milli
o
n
s
7,11
3
6,626 5,861 5,174 4,950 5,105 4,825 4,672 4,427 4,316
3
,
3
70 3,059 2,654 2,284 2,008 2,004 1,845 1,907 1,827 1,818
47.4
%
46.2 % 45.3 % 44.1 % 40.6 % 39.2 % 38.2 % 40.8 % 41.1 % 42.1 %
920
788 693 564 365 343 352 391 431 412
1
2.9
%
11.9 % 11.8 % 10.9 % 7.4 % 6.7 % 7.3 % 8.3 % 9.6 % 9.5 %
3,
32
9
3,211 2,536 2,089 2,172 2,294 1,954 2,286 1,987 1,730
2
,
33
3
2,473 — — — — — — — —
902
865 — — — — — — — —
3
8.7
%
35.0 % — — — — — — — —
109
86 — — — — — — — —
4
.7 % 3.5 % — — — — — — — —
2,91
3
3,217 — — — — — — — —
80
4 856 709 633 637 707 545 441 327 263
3
60 376 312 298 290 345 281 221 160 118
44.7 % 43.9 % 44.0 % 47.0 % 45.5 % 48.8 % 51.5 % 49.5 % 48.4 % 44.9 %
6
5
73 50 48 67 74 63 44 30 20
8.1
%
8.5 % 7.1 % 7.5 % 10.6 % 10.5 % 11.5 % 10.0 % 9.2 % 7.6 %
629
656 692 619 391 433 316 219 156 99