Reebok 2007 Annual Report Download - page 67
Download and view the complete annual report
Please find page 67 of the 2007 Reebok annual report below. You can navigate through the pages in the report by either clicking on the pages listed below, or by using the keyword search tool below to find specific information within the annual report.-
 1
1 -
2
-
3
-
4
-
5
-
6
-
7
-
8
-
9
-
10
-
11
-
12
-
13
-
14
-
15
-
16
-
17
-
18
-
19
-
20
-
21
-
22
-
23
-
24
-
25
-
26
-
27
-
28
-
29
-
30
-
31
-
32
-
33
-
34
-
35
-
36
-
37
-
38
-
39
-
40
-
41
-
42
-
43
-
44
-
45
-
46
-
47
-
48
-
49
-
50
-
51
-
52
-
53
-
54
-
55
-
56
-
 57
57 -
 58
58 -
 59
59 -
 60
60 -
 61
61 -
 62
62 -
 63
63 -
 64
64 -
 65
65 -
 66
66 -
 67
67 -
 68
68 -
 69
69 -
 70
70 -
 71
71 -
 72
72 -
 73
73 -
 74
74 -
 75
75 -
 76
76 -
 77
77 -
78
-
79
-
80
-
81
-
82
-
83
-
84
-
85
-
86
-
87
-
88
-
89
-
90
-
91
-
92
-
93
-
94
-
95
-
96
-
97
-
98
-
99
-
100
-
101
-
102
-
103
-
104
-
105
-
106
-
107
-
108
-
109
-
110
-
111
-
112
-
113
-
114
-
115
-
116
-
117
-
118
-
119
-
120
-
121
-
122
-
123
-
124
-
125
-
126
-
127
-
128
-
129
-
130
-
131
-
132
-
133
-
134
-
135
-
136
-
137
-
138
-
139
-
140
-
141
-
142
-
143
-
144
-
145
-
146
-
147
-
148
-
149
-
150
-
151
-
152
-
153
-
154
-
155
-
156
-
157
-
158
-
159
-
160
-
161
-
162
-
163
-
164
-
165
-
166
-
167
-
168
-
169
-
170
-
171
-
172
-
173
-
174
-
175
-
176
-
177
-
178
-
179
-
180
-
181
-
182
-
183
-
184
-
185
-
186
-
187
-
188
-
189
-
190
-
191
-
192
-
193
-
194
-
195
-
196
-
197
-
198
-
199
-
200
-
201
-
202
-
203
-
204
-
205
-
206
-
207
-
208
-
209
-
210
-
211
-
212
-
213
-
214
-
215
-
216
 |
 |
063
ANNUAL REPORT 2007 --- adidas Group
02
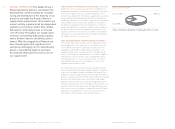
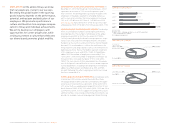
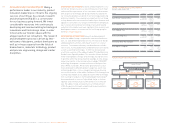
ASIA DOMINATES FOOTWEAR PRODUCTION 96 % of our total
2007 footwear volume for adidas, Reebok and adidas Golf was
produced in this region (2006: 97 %). Production in Europe and
the Americas combined accounted for 4 % of the sourcing
volume (2006: 3 %). China represents our largest source
country with approximately 49 % of the total volume, followed
by Vietnam with 28 % and Indonesia with 16 %. The only signifi -
cant change versus the prior year was a 3 percentage point
decline in Indonesia due to the closure of three factories in the
fourth quarter of 2006, which had manufactured Reebok foot-
wear. In 2007, our footwear suppliers produced approximately
201 million pairs of shoes (2006: approx. 200 million pairs).
The year-over-year increase was solely attributable to a higher
sourcing volume at adidas while footwear purchases at Reebok
declined. Our largest footwear factory produced approximately
11 % of the footwear sourcing volume (2006: 11 %).
Rockport purchased approximately 11 million pairs of foot-
wear in 2007, which represents an increase of 5 % versus the
prior year. Products were primarily sourced from factories
in China (81 %), Vietnam (11 %) and Indonesia (6 %). The
largest factory accounted for 30 % of the total sourcing vol-
ume of the Rockport brand.
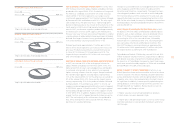
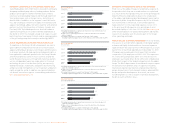
PORTION OF ASIAN-PRODUCED APPAREL GROWS STRONGLY
In 2007, we sourced 82 % of the total apparel volume for
adidas, Reebok and adidas Golf from Asia (2006: 76 %). The
higher proportion of Asian-sourced apparel was attributable
to continued sales growth in Asia, which in turn required
higher sourcing volumes from the region. Europe remained
the second largest apparel sourcing region, representing
13 % of the volume (2006: 16 %). The Americas accounted for
5 % of the volume (2006: 8 %). China was the largest source
country, representing 32 % of the produced volume, followed
by Thailand with 13 % and Indonesia with 11 %. In total, our
suppliers produced approximately 252 million units of apparel
in 2007 (2006: approx. 225 million units). The largest apparel
factory produced approximately 12 % of this apparel volume
in 2007 (2006: 8 %). In addition, Reebok-CCM Hockey sourced
around 2 million units of apparel (primarily hockey jerseys) in
2007. The vast majority of this volume was also produced in
Asia, while small portions were sourced from the Americas
(partic ularly Canada) and Europe.
The Sports Licensed Division sourced approximately 21 million
units of apparel and 18 million units of headwear (2006:
24 million and 18 million, respectively). The majority of pur-
chased apparel products were sourced as unfi nished goods
from Central America (67 %) and Asia (21 %), and were sub-
sequently fi nished in our own screenprinting facilities in the
USA. On the other hand, the majority of headwear sourced was
fi nished products manufactured predominately in Asia (79 %)
and the USA (20 %).
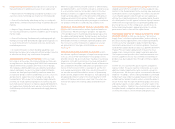
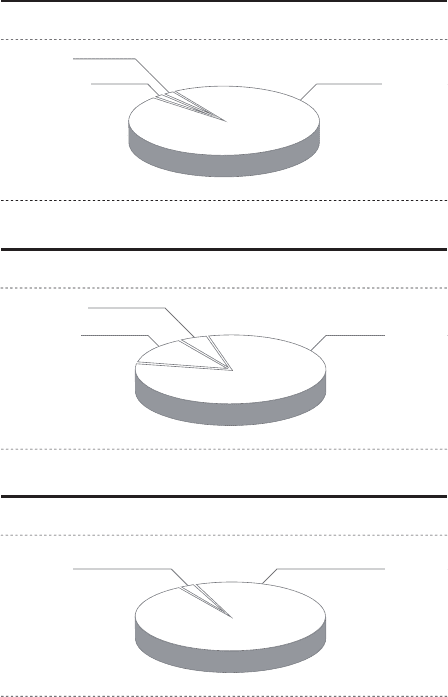
LION’S SHARE OF HARDWARE PRODUCED IN ASIA In 2007,
the bulk (i. e. 96 %) of adidas and Reebok branded hardware
products, such as balls and bags, was also produced in Asia
(2006: 97 %). China remained our largest source country,
accounting for 65 % of the sourced volume, followed by
Vietnam with 17 % and Pakistan with 13 %. The remaining 5 %
was sourced via other Asian and European countries. The
total 2007 hardware sourcing volume was approximately
39 million units (2006: approximately 37 million units) with
the largest factory accounting for 28 % of production.
TaylorMade and Reebok-CCM Hockey sourced 92 % and 98 %
of their hardware volumes from Asia, respectively. In addition,
both brands sourced a small portion of hardware products in
the Americas. At TaylorMade, the majority of golf club compo-
nents were manufactured by suppliers in China and assembled
by TaylorMade in the USA, China and Japan.
BEING CLOSEST TO EVERY CONSUMER All efforts of our
Global Operations team revolve around the vision to be closest
to every consumer. This means meeting consumer demand in
various distribution channels with the right product (in terms
of quality, size, color, style and material) in the right store at
the right time. In addition, it means quickly replenishing fast-
selling products at retail by sharing real-time customer sell-
through data with our suppliers. Being closest to every con-
sumer enables the Group to achieve:
- Higher sales by consistently providing those products
at retail where consumer demand is high.
- Higher gross and operating margins as well as lower Group
inventory levels due to lower product markdowns and faster
sell-throughs.
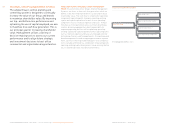
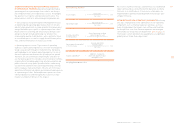
FOOTWEAR PRODUCTION BY REGION 1)
APPAREL PRODUCTION BY REGION 1)
1
)
Fi
g
ures only include adidas, Reebok and adidas Golf brands
.
1
)
Fi
g
ures only include adidas, Reebok and adidas Golf brands
.
Americas
2
%
Americas
5
%
Europe 2
%
Europe
13
%
9
6
%
Asia
82
%
Asia
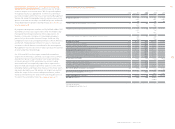
HARDWARE PRODUCTION BY REGION 1)
1) Figures only include adidas and Reebok brands.
Europe 4
%
96
%
Asia