Reebok 2007 Annual Report Download - page 116
Download and view the complete annual report
Please find page 116 of the 2007 Reebok annual report below. You can navigate through the pages in the report by either clicking on the pages listed below, or by using the keyword search tool below to find specific information within the annual report.-
 1
1 -
2
-
3
-
4
-
5
-
6
-
7
-
8
-
9
-
10
-
11
-
12
-
13
-
14
-
15
-
16
-
17
-
18
-
19
-
20
-
21
-
22
-
23
-
24
-
25
-
26
-
27
-
28
-
29
-
30
-
31
-
32
-
33
-
34
-
35
-
36
-
37
-
38
-
39
-
40
-
41
-
42
-
43
-
44
-
45
-
46
-
47
-
48
-
49
-
50
-
51
-
52
-
53
-
54
-
55
-
56
-
57
-
58
-
59
-
60
-
61
-
62
-
63
-
64
-
65
-
66
-
67
-
68
-
69
-
70
-
71
-
72
-
73
-
74
-
75
-
76
-
77
-
78
-
79
-
80
-
81
-
82
-
83
-
84
-
85
-
86
-
87
-
88
-
89
-
90
-
91
-
92
-
93
-
94
-
95
-
96
-
97
-
98
-
99
-
100
-
101
-
102
-
103
-
104
-
105
-
 106
106 -
 107
107 -
 108
108 -
 109
109 -
 110
110 -
 111
111 -
 112
112 -
 113
113 -
 114
114 -
 115
115 -
 116
116 -
 117
117 -
 118
118 -
 119
119 -
 120
120 -
 121
121 -
 122
122 -
 123
123 -
 124
124 -
 125
125 -
 126
126 -
127
-
128
-
129
-
130
-
131
-
132
-
133
-
134
-
135
-
136
-
137
-
138
-
139
-
140
-
141
-
142
-
143
-
144
-
145
-
146
-
147
-
148
-
149
-
150
-
151
-
152
-
153
-
154
-
155
-
156
-
157
-
158
-
159
-
160
-
161
-
162
-
163
-
164
-
165
-
166
-
167
-
168
-
169
-
170
-
171
-
172
-
173
-
174
-
175
-
176
-
177
-
178
-
179
-
180
-
181
-
182
-
183
-
184
-
185
-
186
-
187
-
188
-
189
-
190
-
191
-
192
-
193
-
194
-
195
-
196
-
197
-
198
-
199
-
200
-
201
-
202
-
203
-
204
-
205
-
206
-
207
-
208
-
209
-
210
-
211
-
212
-
213
-
214
-
215
-
216
 |
 |
112
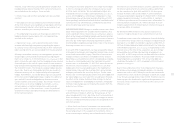
ANNUAL REPORT 2007 --- adidas Group GROUP MANAGEMENT REPORT – OUR FINANCIAL YEAR - Risk and Opportunity Report
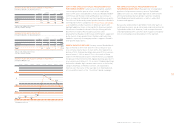
FINANCING AND LIQUIDITY RISKS Liquidity risks arise from
not having the necessary resources available to meet maturing
liabilities with regard to timing, volume and currency structure.
In addition, the adidas Group faces the risk of having to accept
unfavorable fi nancing terms due to liquidity restraints. Our
Group’s Treasury department uses an effi cient cash manage-
ment system to manage liquidity risk. At December 31, 2007,
Group cash and cash equivalents amounted to € 295 million
(2006: € 311 million). Moreover, our Group maintains credit
lines and long-term fi nancing arrangements with leading
banks, such as a € 2 billion international medium-term
syndicated loan facility and a € 2 billion Commercial Paper
Program, in order to ensure suffi cient liquidity at all times.
see Treasury, p. 091
Future cash outfl ows arising from fi nancial liabilities that are
recognized in the Consolidated Balance Sheet are presented
within the adjacent table. This includes payments to settle
obligations from borrowings as well as cash outfl ows from
cash-settled derivatives with negative market values. Financial
liabilities that may be settled in advance without penalty are
included on the basis of the earliest date of potential repay-
ment. Cash fl ows for variable-interest liabilities are deter-
mined with reference to the conditions at the balance sheet
date.
In 2007, we reduced net debt by € 465 million. see Treasury, p. 091
As a result of this effort, we have reduced our exposure to
fi nancing and liquidity risks in 2007. We view these risks as
having a low likelihood of occurrence. Nevertheless, failure to
maintain liquidity could have a high fi nancial impact on Group
performance.
CURRENCY RISKS Currency risks for the adidas Group are a
direct result of multi-currency cash fl ows within the Group.
The biggest single driver behind this risk results from the mis-
match of the currencies required for sourcing our products
versus the denominations of our sales. The vast majority of our
sourcing expenses are in US dollars while sales are denomi-
nated in other currencies to a large extent – most notably the
euro and the British pound. Since Group companies in the UK
are invoiced in euro internally, our main exposures are a US dollar
short and a British pound long exposure versus the euro.
In line with IFRS 7 requirements, we have estimated the impact
on net income and shareholders’ equity based on changes in
our most important currency exchange rates. The calculated
impacts mainly result from our hedging practice. The analysis
does not include effects that arise from the trans lation of our
foreign entities’ fi nancial statements into the Group’s reporting
currency. The sensitivity analysis is based on the net balance
sheet exposure, including inter-company balances from mone-
tary assets and liabilities denominated in foreign currencies.
Moreover, all currency derivatives were re-evaluated using
hypothetical foreign exchange rates to determine the effects
on net income and equity. The analysis was performed on the
same basis for both 2006 and 2007.
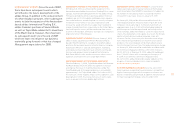
Based on this analysis, a 10 % increase in the euro versus
the US dollar at December 31, 2007, would have led to a
€ 5 million increase in net income. The negative market values
of the US dollar hedges would have decreased shareholders’
equity by € 111 million. A 10 % weaker euro at December 31,
2007 would have led to a € 6 million decrease in net income.
Shareholders’ equity would have increased by € 130 million.
The impacts of fl uctuations of the euro against the British
pound and other major currencies on net income and share-
holders’ equity are also included in accordance with IFRS
requirements.
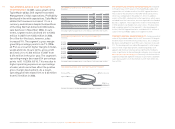
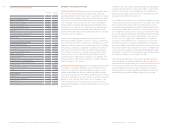
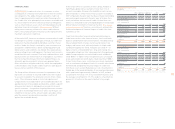
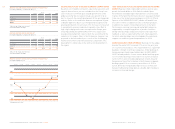
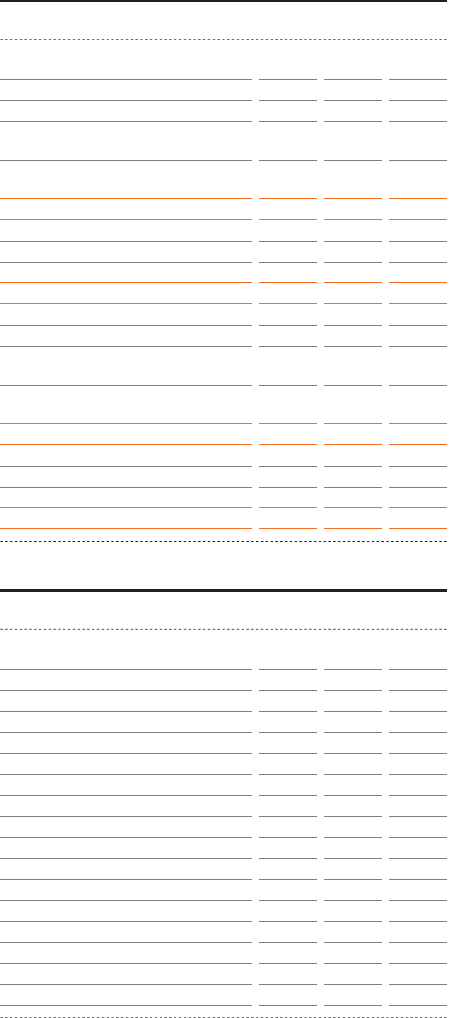
EXPOSURE TO FOREIGN EXCHANGE RISK 1)
b
ased on notional amounts
,
€
in million
s
SENSITIVITY ANALYSIS OF FOREIGN EXCHANGE RATE CHANGES
€
in million
s
USD GBP Other
As at December 31, 2007
Exposure from fi rm commitments and
forecasted transactions
Balance sheet exposure including
intercompany exposure
T
ota
l
gross exposur
e
Hedged with other cash fl ows
Hedged with currency options
Hedged with forward contracts
Net ex
p
osur
e
As at December 31, 2006
Exposure from fi rm commitments and
forecasted transactions
Balance sheet exposure including
intercompany exposure
T
ota
l
gross exposur
e
Hedged with other cash fl ows
Hedged with currency options
Hedged with forward contracts
Net ex
p
osur
e
1)
Roundin
g
differences may arise in totals
.
USD GBP Other
As at December 31, 2007
Euro +10
%
Equity
Net income
Euro –10
%
Equity
Net income
As at December 31, 2006
Euro +10
%
Equity
Net income
Euro –10
%
Equity
Net income
(2,510) 442 726
(65) 15 100
(2,575) 457 825
5
7
)
154 0 0
562 0 141
1,124 153 309
(735) 304 375
5
4
)
(111) 9 9
5 (1) (9)
130 (11) (11)
(6) 2 11
(2,088) 497 701
(67) 76 59
(2,154) 573 760
4)
89 0 0
543 44 90
544 189 226
(978) 340 444
4
)
(53) 12 10
6 (7) (5)
72 (13) (12)
(7) 8 6