Reebok 2007 Annual Report Download - page 2
Download and view the complete annual report
Please find page 2 of the 2007 Reebok annual report below. You can navigate through the pages in the report by either clicking on the pages listed below, or by using the keyword search tool below to find specific information within the annual report.-
 1
1 -
 2
2 -
 3
3 -
 4
4 -
 5
5 -
 6
6 -
 7
7 -
 8
8 -
 9
9 -
 10
10 -
 11
11 -
 12
12 -
 13
13 -
14
-
15
-
16
-
17
-
18
-
19
-
20
-
21
-
22
-
23
-
24
-
25
-
26
-
27
-
28
-
29
-
30
-
31
-
32
-
33
-
34
-
35
-
36
-
37
-
38
-
39
-
40
-
41
-
42
-
43
-
44
-
45
-
46
-
47
-
48
-
49
-
50
-
51
-
52
-
53
-
54
-
55
-
56
-
57
-
58
-
59
-
60
-
61
-
62
-
63
-
64
-
65
-
66
-
67
-
68
-
69
-
70
-
71
-
72
-
73
-
74
-
75
-
76
-
77
-
78
-
79
-
80
-
81
-
82
-
83
-
84
-
85
-
86
-
87
-
88
-
89
-
90
-
91
-
92
-
93
-
94
-
95
-
96
-
97
-
98
-
99
-
100
-
101
-
102
-
103
-
104
-
105
-
106
-
107
-
108
-
109
-
110
-
111
-
112
-
113
-
114
-
115
-
116
-
117
-
118
-
119
-
120
-
121
-
122
-
123
-
124
-
125
-
126
-
127
-
128
-
129
-
130
-
131
-
132
-
133
-
134
-
135
-
136
-
137
-
138
-
139
-
140
-
141
-
142
-
143
-
144
-
145
-
146
-
147
-
148
-
149
-
150
-
151
-
152
-
153
-
154
-
155
-
156
-
157
-
158
-
159
-
160
-
161
-
162
-
163
-
164
-
165
-
166
-
167
-
168
-
169
-
170
-
171
-
172
-
173
-
174
-
175
-
176
-
177
-
178
-
179
-
180
-
181
-
182
-
183
-
184
-
185
-
186
-
187
-
188
-
189
-
190
-
191
-
192
-
193
-
194
-
195
-
196
-
197
-
198
-
199
-
200
-
201
-
202
-
203
-
204
-
205
-
206
-
207
-
208
-
209
-
210
-
211
-
212
-
213
-
214
-
215
-
216
 |
 |
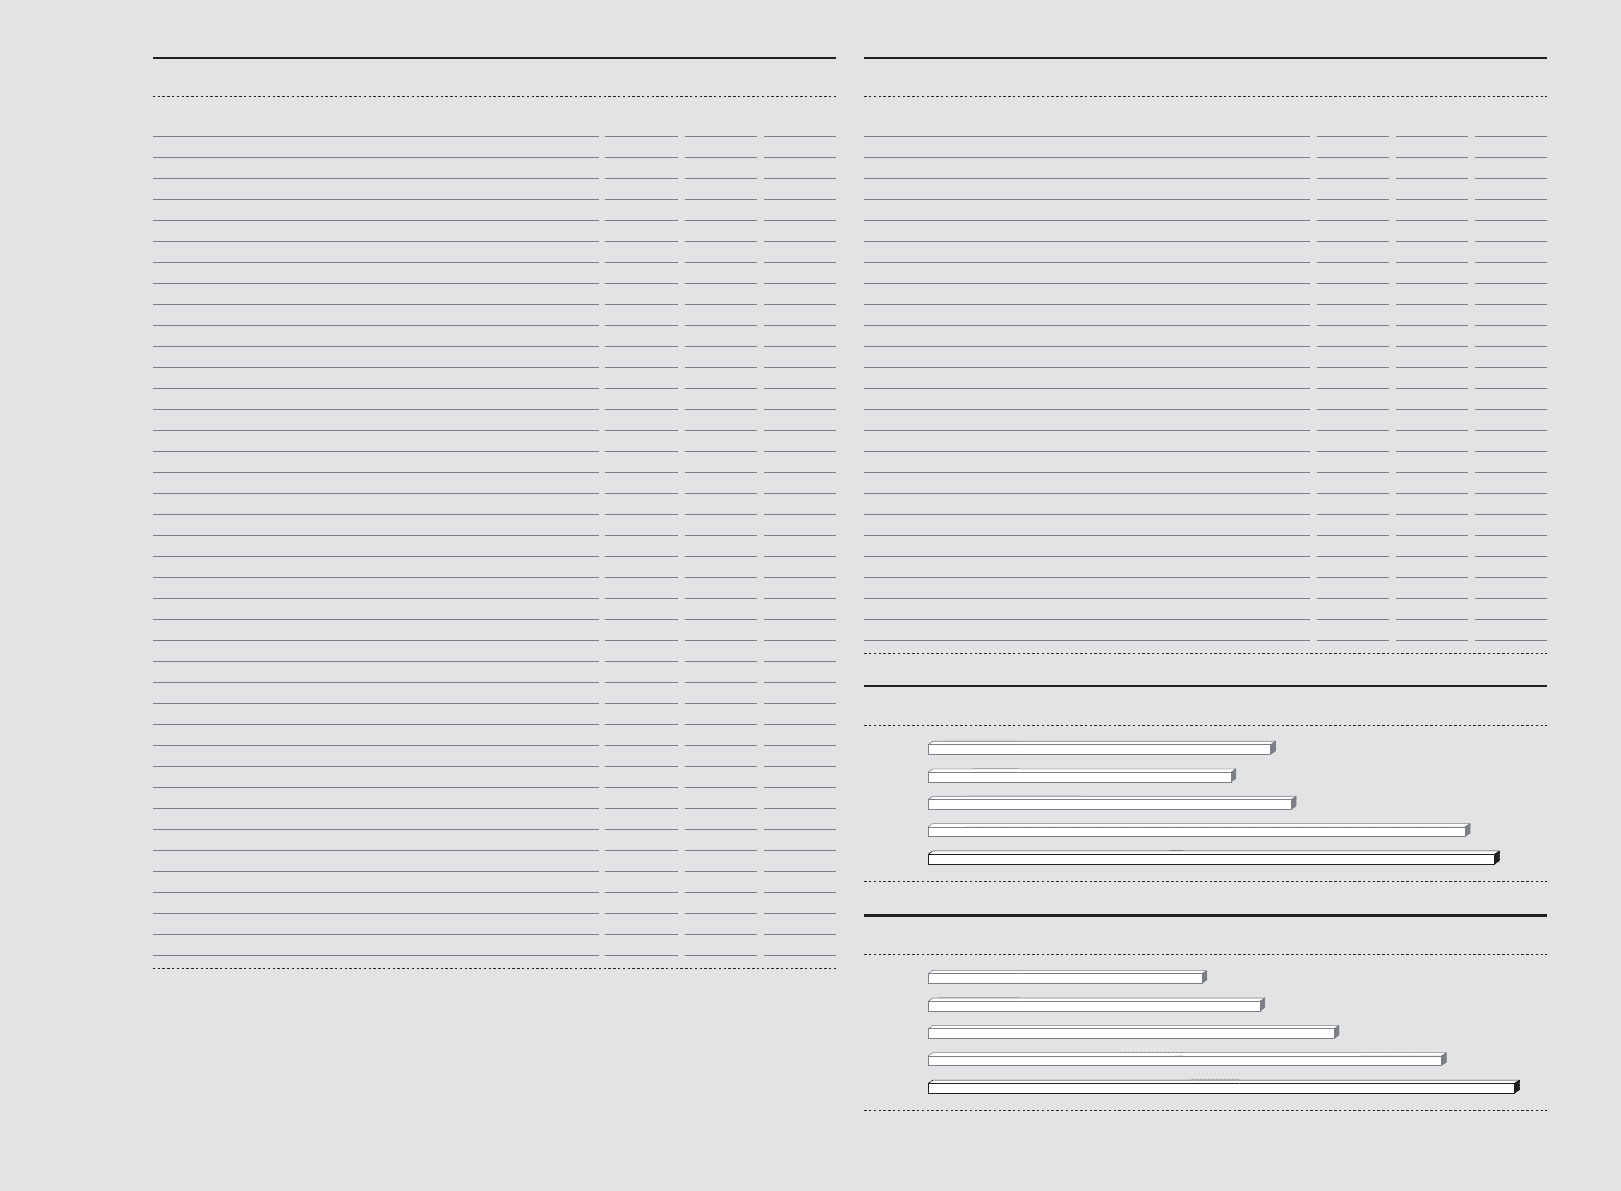
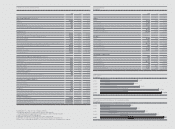
FINANCIAL HIGHLIGHTS (IFRS)
2007 20061) Change
Operating Highlights (€ in millions)
Sales
EBITDA
Operating profi t
Net income attributable to shareholders
Key Ratios (%)
Gross margin
Operating expenses as a percentage of sales
Operating margin
Effective tax rate
Net income attributable to shareholders as a percentage of sales
Operating working capital as a percentage of sales
Equity ratio
Financial leverage
Return on equity
Balance Sheet and Cash Flow Data (€ in millions)
Total assets
Inventories
Receivables and other current assets
Working capital
Net borrowings
Shareholders‘ equity
Capital expenditure
Net cash provided by operating activities
Per Share of Common Stock (€)
Basic earnings
Diluted earnings
Operating cash fl ow
Dividend
Share price at year-end
Other (at year-end)
Number of employees
Number of shares outstanding
Average number of shares
Rounding differences may arise in percentages and totals.
1) Including Reebok business segment from February 1, 2006 onwards.
Including Greg Norman apparel business from February 1, 2006 to November 30, 2006.
2) Subject to Annual General Meeting approval.
3) 2006 fi gures only include eleven months of the twelve-month period.
4) 2006 fi gures include Greg Norman apparel business from February 1 to November 30.
5) Figures refl ect continuing operations as a result of the divestiture of the Salomon business segment.
ADIDAS GROUP
€ in millions
2007 2006 Change
adidas
Sales
Gross profi t
Gross margin
Operating profi t
Operating margin
Number of employees
Reebok 3)
Sales
Gross profi t
Gross margin
Operating profi t
Operating margin
Number of employees
TaylorMade-adidas Golf 4)
Sales
Gross profi t
Gross margin
Operating profi t
Operating margin
Number of employees
10,299 10,084 2.1 %
1,165 1,078 8.0 %
949 881 7.8 %
551 483 14.2 %
47.4 % 44.6 % 2.8 pp
39.2 % 36.7 % 2.5 pp
9.2 % 8.7 % 0.5 pp
31.8 % 31.4 % 0.4 pp
5.4 % 4.8 % 0.6 pp
25.2 % 25.8 % (0.6 pp)
36.3 % 33.8 % 2.6 pp
58.4 % 78.9 % (20.5 pp)
18.2 % 17.1 % 1.2 pp
8,325 8,379 (0.6 %)
1,629 1,607 1.3 %
2,048 1,913 7.1 %
1,708 1,733 (1.5 %)
1,766 2,231 (20.9 %)
3,023 2,828 6.9 %
289 277 4.3 %
780 762 2.4 %
2.71 2.37 14.1 %
2.57 2.25 13.9 %
3.83 3.74 2.5 %
0.50)
2) 0.42 19.0 %
51.26 37.73 35.9 %
31,344 26,376 18.8 %
203,628,960 203,536,860 0.0 %
203,594,975 203,386,104 0.1 %
7,113 6,626 7.3 %
3,370 3,059 10.2 %
47.4 % 46.2 % 1.2 pp
920 788 16.8 %
12.9 % 11.9 % 1.0 pp
18,678 14,906 25.3 %
2,333 2,473 (5.7 %)
902 865 4.4 %
38.7 % 35.0 % 3.7 pp
109 86 26.8 %
4.7 % 3.5 % 1.2 pp
6,751 7,545 (10.5 %)
804 856 (6.0 %)
360 376 (4.2 %)
44.7 % 43.9 % 0.8 pp
65 73 (10.0 %)
8.1 % 8.5 % (0.4 pp)
1,393 1,368 1.8 %
NET SALES
€ in millions
2003
2004 5)
2005 5)
2006 1)
2007
5,860
6,636
10,084
10,299
6,267
NET INCOME ATTRIBUTABLE TO SHAREHOLDERS
€ in millions
2003
2004
2005
2006 1)
2007
314
383
483
551
260