Reebok 2007 Annual Report Download - page 129
Download and view the complete annual report
Please find page 129 of the 2007 Reebok annual report below. You can navigate through the pages in the report by either clicking on the pages listed below, or by using the keyword search tool below to find specific information within the annual report.-
 1
1 -
2
-
3
-
4
-
5
-
6
-
7
-
8
-
9
-
10
-
11
-
12
-
13
-
14
-
15
-
16
-
17
-
18
-
19
-
20
-
21
-
22
-
23
-
24
-
25
-
26
-
27
-
28
-
29
-
30
-
31
-
32
-
33
-
34
-
35
-
36
-
37
-
38
-
39
-
40
-
41
-
42
-
43
-
44
-
45
-
46
-
47
-
48
-
49
-
50
-
51
-
52
-
53
-
54
-
55
-
56
-
57
-
58
-
59
-
60
-
61
-
62
-
63
-
64
-
65
-
66
-
67
-
68
-
69
-
70
-
71
-
72
-
73
-
74
-
75
-
76
-
77
-
78
-
79
-
80
-
81
-
82
-
83
-
84
-
85
-
86
-
87
-
88
-
89
-
90
-
91
-
92
-
93
-
94
-
95
-
96
-
97
-
98
-
99
-
100
-
101
-
102
-
103
-
104
-
105
-
106
-
107
-
108
-
109
-
110
-
111
-
112
-
113
-
114
-
115
-
116
-
117
-
118
-
 119
119 -
 120
120 -
 121
121 -
 122
122 -
 123
123 -
 124
124 -
 125
125 -
 126
126 -
 127
127 -
 128
128 -
 129
129 -
 130
130 -
 131
131 -
 132
132 -
 133
133 -
 134
134 -
 135
135 -
 136
136 -
 137
137 -
 138
138 -
 139
139 -
140
-
141
-
142
-
143
-
144
-
145
-
146
-
147
-
148
-
149
-
150
-
151
-
152
-
153
-
154
-
155
-
156
-
157
-
158
-
159
-
160
-
161
-
162
-
163
-
164
-
165
-
166
-
167
-
168
-
169
-
170
-
171
-
172
-
173
-
174
-
175
-
176
-
177
-
178
-
179
-
180
-
181
-
182
-
183
-
184
-
185
-
186
-
187
-
188
-
189
-
190
-
191
-
192
-
193
-
194
-
195
-
196
-
197
-
198
-
199
-
200
-
201
-
202
-
203
-
204
-
205
-
206
-
207
-
208
-
209
-
210
-
211
-
212
-
213
-
214
-
215
-
216
 |
 |
125
ANNUAL REPORT 2007 --- adidas Group
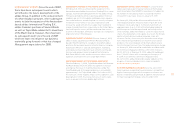
03
2009 REVENUE SYNERGIES FROM REEBOK INTEGRATION
We have an ambitious target to generate around € 500 million
of incremental revenues by 2009 related to the Reebok
inte gration. We estimate one-time expenses associated with
the generation of revenue synergies to be between € 15 mil-
lion and € 25 million in 2009. Specifi c initiatives to generate
revenue synergies include:
- Branded apparel: We expect to deliver around € 100 million
from leveraging adidas’ industry-leading branded apparel
know-how to strengthen and expand Reebok’s branded apparel
efforts.
- Licensed products: At brand adidas, we expect to generate
around € 100 million of additional sales in licensed products.
Having transferred the NBA contract to adidas, we can further
expand this exclusive partnership more effectively – in particu-
lar outside of North America. We will also focus on utilizing
Reebok’s sales and production capabilities for licensed prod-
ucts of brand adidas, particularly in North America.
- Regional initiatives: We expect around € 100 million of
incremental revenue synergies from greater regional traction
in Europe and Asia. This will result from Reebok product
category initiatives in underdeveloped markets with a strong
existing adidas infrastructure.
- Distributor buyouts: We project around € 200 million in
incremental sales synergies to result from exercising more
control over the Reebok brand around the globe, particularly
in high-growth markets in Asia and Latin America as well as
Emerging Europe. This will be achieved by buying out distrib-
utors and joint venture partners.
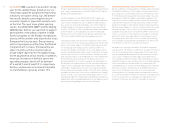
2009 COST SYNERGIES FROM REEBOK INTEGRATION During
our integration planning phase, we identifi ed signifi cant annual
cost of sales and operating expense synergy potential. We
expect to realize the full amount of around € 175 million in
2009. In particular, we project cost savings to come from the
following areas:
- Cost of sales: By integrating Reebok into our Global Opera-
tions function, we expect to achieve a cost of sales reduction
through optimized purchasing processes by 2009.
- Sales and marketing, distribution, administration and IT:
We have also identifi ed the opportunity to generate operating
expense savings by realizing various initiatives such as joint
media buying, offi ce consolidation in Europe and Asia, harmo-
nizing and consolidating our IT systems, eliminating duplicative
corporate functions and sharing fi nance and administrative
services across the Group.
2009 OUTLOOK CONFIRMED As a result of continued under-
lying growth of our brands and the synergies from the Reebok
integration, we expect a strong top- and bottom-line development
again in 2009. We project Group sales to increase at a high-
single-digit rate on a currency-neutral basis. This development
will be driven by continued strength at adidas and TaylorMade-
adidas Golf as well as the ongoing revitalization of the Reebok
business segment. The Group’s gross margin is expected to be
between 46 and 48 % in 2009. Positive effects from an improv-
ing product and geographical mix, own-retail expansion and
cost synergies derived as a result of the integration of Reebok
will be largely offset by increasing input prices driven by higher
raw material prices, freight rates and labor costs. We also
expect the Group’s operating margin to increase to approxi-
mately 11 % in 2009, driven by a modestly lower marketing
working budget as well as effi ciency gains largely related
to Reebok integration cost synergies. This is expected to lead
to an improvement of the Group’s operating expenses as a
percentage of sales. Net income is forecasted to increase at
a double-digit rate in 2009 as a result of our continuing top-line
growth and improved profi tability projected at all brands.
GROUP 2009 FINANCIAL TARGETS
Currency-neutral sales growth high-single-digit
Gross margin 46 % to 48 %
Operating margin approx. 11 %
Net income growth double-digit
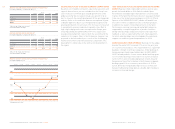
PHASING OF INTEGRATION REVENUE SYNERGIES
€
in million
s
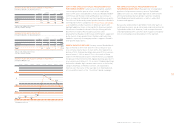
PHASING OF INTEGRATION COST SYNERGIES
€ in million
s
2008 2009
Annual revenue synergies
Average one-time cost per year
2008 2009
Annual cost savings
Average one-time cost per year
Net cost savings
250 500
15 – 25 15 – 25
175 175
70 —
105 175