Reebok 2007 Annual Report Download - page 176
Download and view the complete annual report
Please find page 176 of the 2007 Reebok annual report below. You can navigate through the pages in the report by either clicking on the pages listed below, or by using the keyword search tool below to find specific information within the annual report.-
 1
1 -
2
-
3
-
4
-
5
-
6
-
7
-
8
-
9
-
10
-
11
-
12
-
13
-
14
-
15
-
16
-
17
-
18
-
19
-
20
-
21
-
22
-
23
-
24
-
25
-
26
-
27
-
28
-
29
-
30
-
31
-
32
-
33
-
34
-
35
-
36
-
37
-
38
-
39
-
40
-
41
-
42
-
43
-
44
-
45
-
46
-
47
-
48
-
49
-
50
-
51
-
52
-
53
-
54
-
55
-
56
-
57
-
58
-
59
-
60
-
61
-
62
-
63
-
64
-
65
-
66
-
67
-
68
-
69
-
70
-
71
-
72
-
73
-
74
-
75
-
76
-
77
-
78
-
79
-
80
-
81
-
82
-
83
-
84
-
85
-
86
-
87
-
88
-
89
-
90
-
91
-
92
-
93
-
94
-
95
-
96
-
97
-
98
-
99
-
100
-
101
-
102
-
103
-
104
-
105
-
106
-
107
-
108
-
109
-
110
-
111
-
112
-
113
-
114
-
115
-
116
-
117
-
118
-
119
-
120
-
121
-
122
-
123
-
124
-
125
-
126
-
127
-
128
-
129
-
130
-
131
-
132
-
133
-
134
-
135
-
136
-
137
-
138
-
139
-
140
-
141
-
142
-
143
-
144
-
145
-
146
-
147
-
148
-
149
-
150
-
151
-
152
-
153
-
154
-
155
-
156
-
157
-
158
-
159
-
160
-
161
-
162
-
163
-
164
-
165
-
 166
166 -
 167
167 -
 168
168 -
 169
169 -
 170
170 -
 171
171 -
 172
172 -
 173
173 -
 174
174 -
 175
175 -
 176
176 -
 177
177 -
 178
178 -
 179
179 -
 180
180 -
 181
181 -
 182
182 -
 183
183 -
 184
184 -
 185
185 -
 186
186 -
187
-
188
-
189
-
190
-
191
-
192
-
193
-
194
-
195
-
196
-
197
-
198
-
199
-
200
-
201
-
202
-
203
-
204
-
205
-
206
-
207
-
208
-
209
-
210
-
211
-
212
-
213
-
214
-
215
-
216
 |
 |

172
ANNUAL REPORT 2007 --- adidas Group CONSOLIDATED FINANCIAL STATEMENTS - Notes to the Consolidated Balance Sheet
The actuarial valuations of the defi ned benefi t plans are made at the end of each reporting
period. The assumptions for employee turnover and mortality are based on empirical data, the
latter for Germany on the 2005 G version of the mortality tables of Dr. Heubeck. The actuarial
assumptions in Germany and in other countries are not materially different.
As of January 1, 2005, due to application of the amendment to IAS 19 “Employee Benefi ts”
issued in December 2004, the Group recognizes actuarial gains or losses of defi ned benefi t plans
arising during the fi nancial year immediately outside the income statement in the statement
of recognized income and expense. The actuarial gain recognized in the statement of recog-
nized income and expense for 2007 was € 18 million (2006: € 2 million). The cumulative recog-
nized actuarial losses amounted to € 12 million (2006: € 30 million). see also Note 21
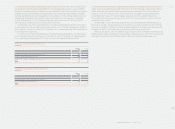
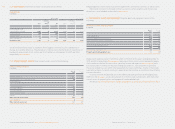
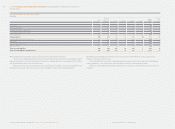
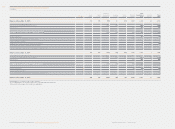
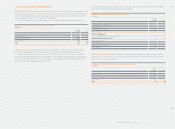
PENSION EXPENSES FOR DEFINED BENEFIT PLANS
€ in millions
Year ending Dec. 31
2
007 2006
Current service cost
Interest cost
Expected return on plan assets
P
ension expense
s
1
2 7
7
5
(4) (1)
15 11
Of the total pension expenses, an amount of € 12 million (2006: € 7 million) relates to employees
in Germany. Contributions to post-employment benefi t plans for employees living in Germany for
the year ending December 31, 2008, are expected to amount to € 7 million. The pension expense
is recorded within the operating expenses whereas the production-related part thereof is recog-
nized within the cost of sales.
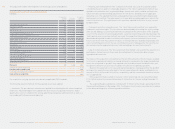
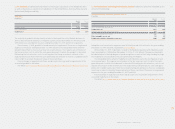
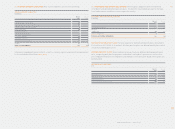
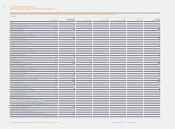
DEFINED BENEFIT OBLIGATION
€ in millions
2
007 2006
D
e
fi
ned bene
fi
t obli
g
ation as at January
1
Increase in companies consolidated
Currency translation differences
Current service cost
Interest cost
Pensions paid
Actuarial gain
D
efi ned benefi t obli
g
ation as at December
31
170 131
—
34
2
1
1
2 7
7
5
(
6
)
(6)
(
14
)
(2)
171 170
STATUS OF FUNDED AND UNFUNDED OBLIGATIONS
€
in milli
o
n
s
D
ec. 31 Dec. 31
2
007
2006
Present value of unfunded obligation
Present value of funded obligation
Present value o
f
total obligations
Fair value of plan assets 1)
Recognized liability for defi ned benefi t obligations
1) A portion of the € 60 million (2006: € 46 million) total of plan assets cannot be deducted, as it is not possible to use the exceeding amount
f
or another
p
lan.
1
14 110
57
60
171
1
7
0
(
56
)
(44)
115
1
2
6
6
The calculations of recognized assets and liabilities from defi ned benefi t plans are based upon
statistical and actuarial calculations. In particular, the present value of the defi ned benefi t obli-
gation is impacted by assumptions on discount rates used to arrive at the present value of future
pension liabilities and assumptions on future increases in salaries and benefi ts. Furthermore,
the Group’s independent actuaries use statistically based assumptions covering areas such as
future participant plan withdrawals and estimates on life expectancy. The actuarial assumptions
used may differ materially from actual results due to changes in market and economic condi-
tions, higher or lower withdrawal rates, or longer or shorter life spans of participants and other
changes in the factors being assessed. These differences could impact the assets or liabilities
recognized in the balance sheet in future periods.
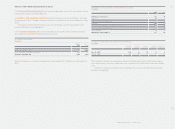
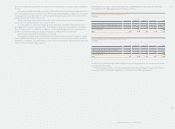
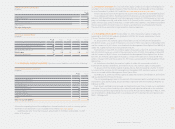
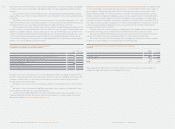
MOVEMENT IN PLAN ASSETS
€
in million
s
2007
2006
Fair value of plan assets at January 1
Increase in companies consolidated
Currency translation differences
Pensions paid
Contributions paid into the plan
Actuarial gain
Expected return on plan assets
Fair value of
p
lan assets at December
3
1
46 —
—
25
(
3
)
—
(
1
)
—
1
0
20
4
—
4
1
60 46
Contributions into the plan are only paid by the employer. In 2008, the expected payments into
the plan amount to € 1 million. The plan assets are invested in several pension funds. The return
on plan assets is in conformity with the current strategy of the pension funds. In 2007, the actual
return on plan assets was € 7 million (2006: € 2 million).