Reebok 2007 Annual Report Download - page 105
Download and view the complete annual report
Please find page 105 of the 2007 Reebok annual report below. You can navigate through the pages in the report by either clicking on the pages listed below, or by using the keyword search tool below to find specific information within the annual report.-
 1
1 -
2
-
3
-
4
-
5
-
6
-
7
-
8
-
9
-
10
-
11
-
12
-
13
-
14
-
15
-
16
-
17
-
18
-
19
-
20
-
21
-
22
-
23
-
24
-
25
-
26
-
27
-
28
-
29
-
30
-
31
-
32
-
33
-
34
-
35
-
36
-
37
-
38
-
39
-
40
-
41
-
42
-
43
-
44
-
45
-
46
-
47
-
48
-
49
-
50
-
51
-
52
-
53
-
54
-
55
-
56
-
57
-
58
-
59
-
60
-
61
-
62
-
63
-
64
-
65
-
66
-
67
-
68
-
69
-
70
-
71
-
72
-
73
-
74
-
75
-
76
-
77
-
78
-
79
-
80
-
81
-
82
-
83
-
84
-
85
-
86
-
87
-
88
-
89
-
90
-
91
-
92
-
93
-
94
-
 95
95 -
 96
96 -
 97
97 -
 98
98 -
 99
99 -
 100
100 -
 101
101 -
 102
102 -
 103
103 -
 104
104 -
 105
105 -
 106
106 -
 107
107 -
 108
108 -
 109
109 -
 110
110 -
 111
111 -
 112
112 -
 113
113 -
 114
114 -
 115
115 -
116
-
117
-
118
-
119
-
120
-
121
-
122
-
123
-
124
-
125
-
126
-
127
-
128
-
129
-
130
-
131
-
132
-
133
-
134
-
135
-
136
-
137
-
138
-
139
-
140
-
141
-
142
-
143
-
144
-
145
-
146
-
147
-
148
-
149
-
150
-
151
-
152
-
153
-
154
-
155
-
156
-
157
-
158
-
159
-
160
-
161
-
162
-
163
-
164
-
165
-
166
-
167
-
168
-
169
-
170
-
171
-
172
-
173
-
174
-
175
-
176
-
177
-
178
-
179
-
180
-
181
-
182
-
183
-
184
-
185
-
186
-
187
-
188
-
189
-
190
-
191
-
192
-
193
-
194
-
195
-
196
-
197
-
198
-
199
-
200
-
201
-
202
-
203
-
204
-
205
-
206
-
207
-
208
-
209
-
210
-
211
-
212
-
213
-
214
-
215
-
216
 |
 |
101
ANNUAL REPORT 2007 --- adidas Group
03
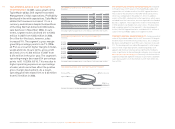
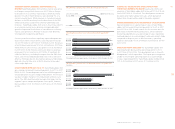
CURRENCY-NEUTRAL OWN-RETAIL SALES GROW 31 %
In 2007, Reebok own-retail sales grew 31 % on a currency- neutral
basis. In euro terms, revenues increased 22 % to € 371 million
from € 304 million in 2006. The fi rst-time inclusion of January,
which was not consolidated in 2006 due to the timing of the
acquisition, had a positive impact on revenue growth. On a like-
for-like basis, comparing sales for the full year periods of
both 2006 and 2007, Reebok own-retail sales increased 23 %.
Reebok own-retail activities made up 16 % of Reebok segment
sales in 2007, up from 12 % in the prior year. The share of own-
retail activities as a percentage of brand sales at Rockport was
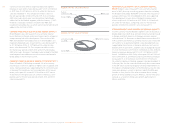
signifi cantly above the segment average. The store base at
the end of 2007 comprised 142 concept stores and 288 factory
outlets. During the year, Reebok opened 95 concept stores and
52 factory outlets. Major openings in 2007 included concept
stores in Hong Kong and Moscow.
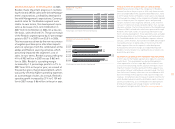
REEBOK SEGMENT GROSS MARGIN SUPPORTED BY REALIZA-
TION OF COST SYNERGIES The gross margin of the Reebok
segment increased 3.7 percentage points to 38.7 % in 2007
from 35.0 % in 2006. This development was in line with
Management’s initial expectation of a gross margin increase.
The improvement was driven by the non-recurrence of negative
impacts from purchase price allocation. In 2006, these charges
amounted to € 76 million. In addition, cost synergies in the
segment’s cost of sales resulting from the combination of
adidas and Reebok sourcing activities had a positive effect.
A shift in the segment’s sales mix towards regions with
higher margins was partly offset by negative effects from
selective clearance initiatives in North America. In euro
terms, Reebok gross profi t grew 4 % to € 902 million in 2007
versus € 865 million in 2006.
ROYALTY AND COMMISSION INCOME INCREASES In 2007,
Reebok royalty and commission income grew 24 % to € 42 mil-
lion from € 34 million in the prior year. This improvement was
mainly due to the fi rst-time inclusion of January revenues.
Higher royalty rates also contributed to the increase. Reebok’s
royalty and commission income primarily relates to royalty
income for fi tness equipment.
OPERATING EXPENSES INCREASE Operating expenses as a
percentage of sales increased by 3.0 percentage points to 35.8 %
in 2007 versus 32.8 % in 2006. Additional expenses amounting
to around € 50 million for marketing, product development and
initiatives to grow the brand in emerging markets drove this
increase. These expenses mainly impacted the fi rst half of the
year. The majority was spent for the brand’s largest advertising
campaign of the year, “Run Easy”. see Reebok Strategy, p. 050 One-
time costs for the Reebok integration into the adidas Group
also negatively affected operating overhead development. The
negative effect from purchase price allocation on operating
expenses was € 12 million in 2007 (2006: € 13 million). Reebok’s
operating expenses grew 3 % to € 835 million in 2007 from
€ 812 million in the prior year.
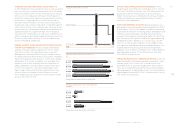
OPERATING MARGIN UP 1.2 PERCENTAGE POINTS In 2007, the
operating margin of the Reebok segment increased by 1.2 per-
centage points to 4.7 % from 3.5 % in the prior year. This
de velopment was in line with Management’s initial expecta-
tions. Gross margin improvement more than offset the higher
operating expenses as a percentage of sales. As a result, Reebok’s
operating profi t increased 27 % to € 109 million in 2007 versus
€ 86 million in the prior year.
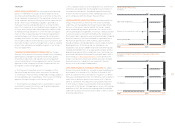
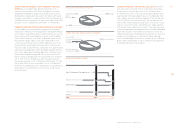
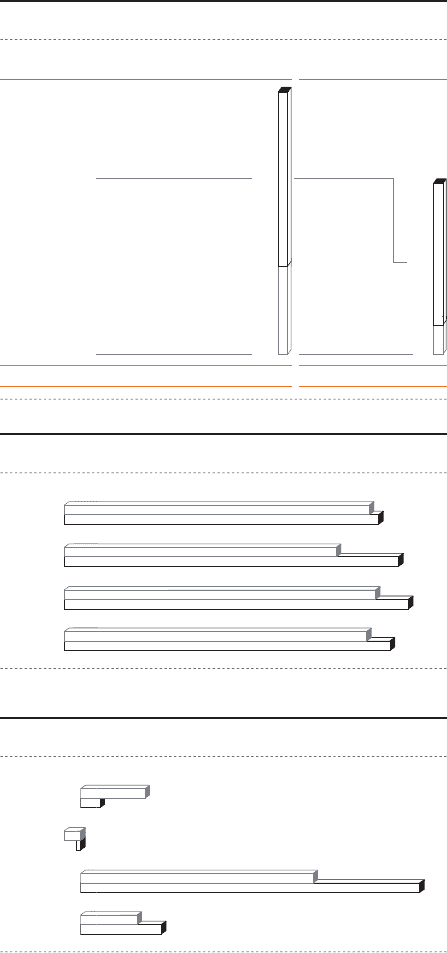
REEBOK GROSS MARGIN BY QUARTER
in
%
Q1 2006 1)
Q
1
2007
Q2 2006
Q2
2007
Q3 2006
Q
3 200
7
Q4 2006
Q
4
2007
1
) Only includes two months of the three-month
p
eriod
.
4
0
.
2
36.4
39.1
31.9
3
6.
8
35.7
38.
1
35.4
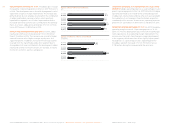
REEBOK OPERATING PROFIT BY QUARTER
€ in million
s
Q1 2006 1)
Q
1
2007
Q2 2006
Q2
2007
Q3 2006
Q
3 200
7
Q4 2006
Q
4
2007
1)
Only includes two months of the three-month period
.
84
58
(
1
)
(4)
6
17
21
15
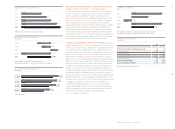
200
7 2006
Tota
l
43
0 283
47
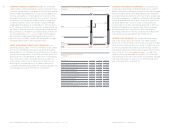
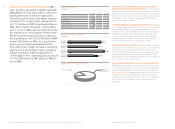
REEBOK OWN-RETAIL STORES
Concept Stores 142
236
F
actor
y
O
utlets
288