Reebok 2007 Annual Report Download - page 104
Download and view the complete annual report
Please find page 104 of the 2007 Reebok annual report below. You can navigate through the pages in the report by either clicking on the pages listed below, or by using the keyword search tool below to find specific information within the annual report.-
 1
1 -
2
-
3
-
4
-
5
-
6
-
7
-
8
-
9
-
10
-
11
-
12
-
13
-
14
-
15
-
16
-
17
-
18
-
19
-
20
-
21
-
22
-
23
-
24
-
25
-
26
-
27
-
28
-
29
-
30
-
31
-
32
-
33
-
34
-
35
-
36
-
37
-
38
-
39
-
40
-
41
-
42
-
43
-
44
-
45
-
46
-
47
-
48
-
49
-
50
-
51
-
52
-
53
-
54
-
55
-
56
-
57
-
58
-
59
-
60
-
61
-
62
-
63
-
64
-
65
-
66
-
67
-
68
-
69
-
70
-
71
-
72
-
73
-
74
-
75
-
76
-
77
-
78
-
79
-
80
-
81
-
82
-
83
-
84
-
85
-
86
-
87
-
88
-
89
-
90
-
91
-
92
-
93
-
 94
94 -
 95
95 -
 96
96 -
 97
97 -
 98
98 -
 99
99 -
 100
100 -
 101
101 -
 102
102 -
 103
103 -
 104
104 -
 105
105 -
 106
106 -
 107
107 -
 108
108 -
 109
109 -
 110
110 -
 111
111 -
 112
112 -
 113
113 -
 114
114 -
115
-
116
-
117
-
118
-
119
-
120
-
121
-
122
-
123
-
124
-
125
-
126
-
127
-
128
-
129
-
130
-
131
-
132
-
133
-
134
-
135
-
136
-
137
-
138
-
139
-
140
-
141
-
142
-
143
-
144
-
145
-
146
-
147
-
148
-
149
-
150
-
151
-
152
-
153
-
154
-
155
-
156
-
157
-
158
-
159
-
160
-
161
-
162
-
163
-
164
-
165
-
166
-
167
-
168
-
169
-
170
-
171
-
172
-
173
-
174
-
175
-
176
-
177
-
178
-
179
-
180
-
181
-
182
-
183
-
184
-
185
-
186
-
187
-
188
-
189
-
190
-
191
-
192
-
193
-
194
-
195
-
196
-
197
-
198
-
199
-
200
-
201
-
202
-
203
-
204
-
205
-
206
-
207
-
208
-
209
-
210
-
211
-
212
-
213
-
214
-
215
-
216
 |
 |
100
ANNUAL REPORT 2007 --- adidas Group GROUP MANAGEMENT REPORT – OUR FINANCIAL YEAR -- Business Performance by Segment - Reebok Business Performance
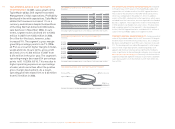
ROCKPORT SALES GROW 7 % ON A CURRENCY-NEUTRAL
BASIS Rockport sales increased 7 % on a currency-neutral
basis in
2007, driven by several new product launches including
the Rockport with adidas TORSION®
collection. The inclusion of
January, which was not consoli dated in 2006, also supported
this development. In euro terms, Rockport revenues were
almost stable at € 291 million in 2007 (2006: € 293 million).
On a like-for-like basis, com paring sales for the full year
periods of both 2006 and 2007, sales increased 1 %.
STRONG SEGMENT SALES GROWTH IN EMERGING MARKETS
In 2007, currency-neutral Reebok segment sales increased at a
double-digit rate in both Asia and Latin America, but decreased
in Europe and North America. In Europe, currency-neutral
sales declined 1 %. Revenues in North America were down 5 %.
In Asia and in Latin America, currency-neutral sales increased
24 % and 32 %, respectively. Reebok’s sales development was
supported by the inclusion of January, which was not consoli-
dated in 2006. In euro terms, segment sales in Europe decreased
3 % to € 748 million in 2007 from € 768 million in 2006. In North
America, revenues decreased 13 % to € 1.231 billion in 2007
from € 1.408 billion in 2006. Sales in Asia grew 18 % to € 269 mil-
lion in 2007 (2006: € 229 million), and in Latin America revenues
increased 21 % to € 84 million in 2007 (2006: € 69 million).
On a like-for-like basis, Reebok segment sales declined by 5 %.
In Europe, like-for-like sales declined mainly due to a decrease
in the UK which could only be partly offset by improvements in
the region’s emerging markets. In North America, like-for-like
sales were down as a result of declines in both the USA and
Canada. In Asia, like-for-like sales increased due to strong
growth in China and India. In Latin America, like-for-like sales
were up as a result of strong sales growth, particularly in
Mexico and Chile.
Currency translation effects negatively impacted segment
revenues in euro terms. Sales decreased 6 % to € 2.333 billion
in 2007 from € 2.473 billion in 2006. On a like-for-like basis,
sales declined by 5 %. This comparison refl ects sales for
the full year periods of both 2006 and 2007. It also includes
GNC retail sales which were transferred from TaylorMade-
adidas Golf to the Reebok segment, effective January 1, 2007.
However, it excludes revenues related to the NBA and
Liverpool licensed businesses which were transferred to brand
adidas in the fi rst half of 2006.
CURRENCY-NEUTRAL SALES OF BRAND REEBOK DOWN 2 %
Brand Reebok sales decreased 2 % on a currency-neutral
basis. Declines in lifestyle and in most major sports categories
except running led to this development. The transfer of the
NBA and Liverpool licensed businesses to brand adidas also
negatively impacted sales. In euro terms, sales decreased 7 %
to € 1.831 billion (2006: € 1.979 billion). On a like-for-like
basis, sales decreased 7 %. This comparison refl ects sales
for the full year periods of both 2006 and 2007 and includes
GNC retail sales. However, it excludes sales related to the NBA
and Liverpool licensed businesses which were transferred to
brand adidas in the fi rst half of 2006.
CURRENCY-NEUTRAL SALES OF REEBOK-CCM HOCKEY UP 9 %
Sales of Reebok-CCM Hockey increased 9 % on a currency-
neutral basis in 2007. In addition to higher sales in apparel and
sticks, revenue growth was supported by the fi rst-time inclusion
of January. This month was not consolidated in 2006. In euro
terms, sales grew 4 % to reach € 210 million in 2007 versus
€ 202 million in the prior year. On a like-for-like basis, com-
paring sales for the full year periods of both 2006 and 2007,
sales increased 3 %.
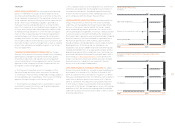
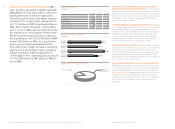
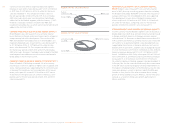
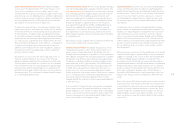
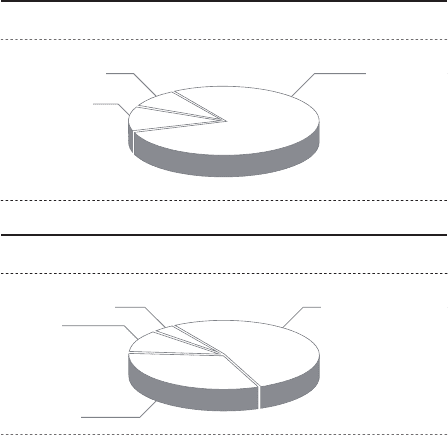
REEBOK 2007 NET SALES BY DIVISION
REEBOK 2007 NET SALES BY REGION
Reebok-
CCM Hockey 9
%
Rockport 12
%
79
%
Reebok
Latin America
4
%
Europe
3
2
%
Asia 11 %
53
%
North America