Reebok 2007 Annual Report Download - page 95
Download and view the complete annual report
Please find page 95 of the 2007 Reebok annual report below. You can navigate through the pages in the report by either clicking on the pages listed below, or by using the keyword search tool below to find specific information within the annual report.-
 1
1 -
2
-
3
-
4
-
5
-
6
-
7
-
8
-
9
-
10
-
11
-
12
-
13
-
14
-
15
-
16
-
17
-
18
-
19
-
20
-
21
-
22
-
23
-
24
-
25
-
26
-
27
-
28
-
29
-
30
-
31
-
32
-
33
-
34
-
35
-
36
-
37
-
38
-
39
-
40
-
41
-
42
-
43
-
44
-
45
-
46
-
47
-
48
-
49
-
50
-
51
-
52
-
53
-
54
-
55
-
56
-
57
-
58
-
59
-
60
-
61
-
62
-
63
-
64
-
65
-
66
-
67
-
68
-
69
-
70
-
71
-
72
-
73
-
74
-
75
-
76
-
77
-
78
-
79
-
80
-
81
-
82
-
83
-
84
-
 85
85 -
 86
86 -
 87
87 -
 88
88 -
 89
89 -
 90
90 -
 91
91 -
 92
92 -
 93
93 -
 94
94 -
 95
95 -
 96
96 -
 97
97 -
 98
98 -
 99
99 -
 100
100 -
 101
101 -
 102
102 -
 103
103 -
 104
104 -
 105
105 -
106
-
107
-
108
-
109
-
110
-
111
-
112
-
113
-
114
-
115
-
116
-
117
-
118
-
119
-
120
-
121
-
122
-
123
-
124
-
125
-
126
-
127
-
128
-
129
-
130
-
131
-
132
-
133
-
134
-
135
-
136
-
137
-
138
-
139
-
140
-
141
-
142
-
143
-
144
-
145
-
146
-
147
-
148
-
149
-
150
-
151
-
152
-
153
-
154
-
155
-
156
-
157
-
158
-
159
-
160
-
161
-
162
-
163
-
164
-
165
-
166
-
167
-
168
-
169
-
170
-
171
-
172
-
173
-
174
-
175
-
176
-
177
-
178
-
179
-
180
-
181
-
182
-
183
-
184
-
185
-
186
-
187
-
188
-
189
-
190
-
191
-
192
-
193
-
194
-
195
-
196
-
197
-
198
-
199
-
200
-
201
-
202
-
203
-
204
-
205
-
206
-
207
-
208
-
209
-
210
-
211
-
212
-
213
-
214
-
215
-
216
 |
 |
091
ANNUAL REPORT 2007 --- adidas Group
03
T
REASUR
Y
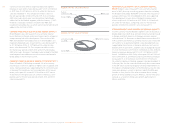
GROUP FINANCING POLICY The major goal of our fi nancing
policy is to minimize the Group’s fi nancial expenses while
ensuring suffi cient liquidity reserves at all times to meet the
Group’s payment commitments. The operating activities of our
Group segments and the resulting cash infl ows represent the
Group’s main source of liquidity. Liquidity is planned on a
multi-year fi nancial and liquidity plan on a rolling monthly
basis. This comprises all consolidated Group companies. Our
in-house bank concept takes advantage of the surplus funds
of individual Group companies to cover the fi nancial require-
ments of others, reducing external fi nancing requirements
and optimizing our net interest expenses. By settling inter-
company transactions via inter-company fi nancial accounts,
we are able to reduce external bank account transactions and
thus bank charges. Currency management as well as ongoing
interest rate optimization are additional goals of our Group
Treasury department.
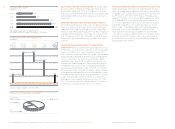
TREASURY SYSTEM AND RESPONSIBILITIES Our Group’s
Treasury Policy governs all treasury-related issues, including
banking policy and approval of bank relationships, global
fi nancing arrangements and liquidity / asset management,
currency and interest risk management as well as the man-
agement of inter-company cash fl ows. Responsibilities are
arranged in a three-tiered approach:
- The Treasury Committee consists of members of the
Executive Board and other senior executives who decide
on the Group’s Treasury Policy and provide strategic guidance
for managing treasury-related topics. The Treasury Committee
approves all major changes to our Treasury Policy.
- The Group Treasury department is responsible for specifi c
centralized treasury transactions and for global implemen-
tation of our Group’s Treasury Policy.
- On a subsidiary level, local managing directors and fi nancial
controllers are responsible for managing treasury matters in
the respective subsidiaries. Brand and regional controlling
ensures that the transactions of the individual business units
are in compliance with the Group’s Treasury Policy.
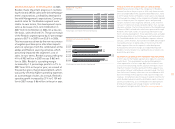
CENTRALIZED TREASURY FUNCTION In accordance with our
Group’s Treasury Policy, more than 90 % of our worldwide
credit lines are managed by the Group Treasury department.
Portions of those lines are allocated to the Group’s subsid-
iaries and backed by parental guarantees. As a result of this
centralized liquidity management, the Group is well positioned
to allocate resources effi ciently throughout the organization.
The Group’s debt is generally unsecured and includes standard
fi nancial covenants, which are reviewed on a quarterly basis.
We maintain good relations with numerous partner banks,
thereby avoiding a strong dependency on any single institution.
Banking partners of the Group and our subsidiaries are
required to have at least a BBB+ long-term investment grade
rating by Standard & Poor’s or an equivalent rating by another
leading rating agency. Only in exceptional cases are Group com-
panies and subsidiaries authorized to work with banks with a
lower rating. see Risk and Opportunity Report, p. 104 To optimize the
Group’s cash position and ensure optimal allocation of liquid
fi nancial resources, subsidiaries are required to transfer
excess cash to the Group’s headquarters.
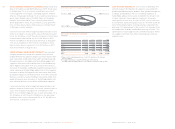
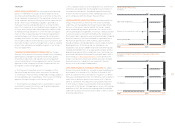
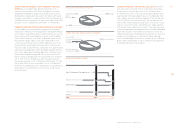
LONG-TERM FINANCIAL FLEXIBILITY ENSURED The adidas
Group’s long-term fl exibility is ensured by unutilized fi nancial
instruments in an amount of € 4.1 billion at the end of 2007
(2006: € 4.4 billion). These instruments include a € 2.0 billion
multi-year syndicated loan (2006: € 2.0 billion) as well as bilateral
credit lines at different banks in an amount of € 2.1 billion
(2006: € 2.4 billion). The reduction of unutilized credit lines
in 2007 refl ects the decreased need for fi nancial fl exibility
as a result of the Group’s strong progress in gross borrowings
reduction in 2007. We monitor the ongoing need for available
credit lines based on the current level of debt as well as future
fi nancing requirements.
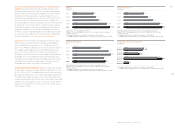
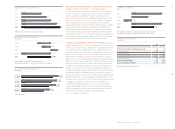
2007 2006
To
t
al
6,
2
6
2
6,935
591
2,
879
985
2,
480
REMAINING TIME TO MATURITY OF AVAILABLE FACILITIES
€
in milli
o
n
s
3 to 5
y
ears
2
,
3
7
6
1 to 3 years 967
> 5 years 419
< 1 year
2,
500
200
7 2006
T
ota
l
6,
2
6
2
6,935
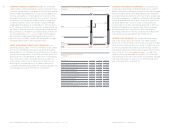
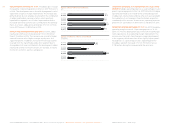
TOTAL CREDIT FACILITIES
€
in millions
P
rivate placements
1
,
564
Medium-term committed credit lines 2,000
Convertible bond 384
S
h
o
rt-t
e
rm
c
r
ed
it lin
es
2
,31
4
375
2
,77
6
2,000
1,7
84