Reebok 2007 Annual Report Download - page 103
Download and view the complete annual report
Please find page 103 of the 2007 Reebok annual report below. You can navigate through the pages in the report by either clicking on the pages listed below, or by using the keyword search tool below to find specific information within the annual report.-
 1
1 -
2
-
3
-
4
-
5
-
6
-
7
-
8
-
9
-
10
-
11
-
12
-
13
-
14
-
15
-
16
-
17
-
18
-
19
-
20
-
21
-
22
-
23
-
24
-
25
-
26
-
27
-
28
-
29
-
30
-
31
-
32
-
33
-
34
-
35
-
36
-
37
-
38
-
39
-
40
-
41
-
42
-
43
-
44
-
45
-
46
-
47
-
48
-
49
-
50
-
51
-
52
-
53
-
54
-
55
-
56
-
57
-
58
-
59
-
60
-
61
-
62
-
63
-
64
-
65
-
66
-
67
-
68
-
69
-
70
-
71
-
72
-
73
-
74
-
75
-
76
-
77
-
78
-
79
-
80
-
81
-
82
-
83
-
84
-
85
-
86
-
87
-
88
-
89
-
90
-
91
-
92
-
 93
93 -
 94
94 -
 95
95 -
 96
96 -
 97
97 -
 98
98 -
 99
99 -
 100
100 -
 101
101 -
 102
102 -
 103
103 -
 104
104 -
 105
105 -
 106
106 -
 107
107 -
 108
108 -
 109
109 -
 110
110 -
 111
111 -
 112
112 -
 113
113 -
114
-
115
-
116
-
117
-
118
-
119
-
120
-
121
-
122
-
123
-
124
-
125
-
126
-
127
-
128
-
129
-
130
-
131
-
132
-
133
-
134
-
135
-
136
-
137
-
138
-
139
-
140
-
141
-
142
-
143
-
144
-
145
-
146
-
147
-
148
-
149
-
150
-
151
-
152
-
153
-
154
-
155
-
156
-
157
-
158
-
159
-
160
-
161
-
162
-
163
-
164
-
165
-
166
-
167
-
168
-
169
-
170
-
171
-
172
-
173
-
174
-
175
-
176
-
177
-
178
-
179
-
180
-
181
-
182
-
183
-
184
-
185
-
186
-
187
-
188
-
189
-
190
-
191
-
192
-
193
-
194
-
195
-
196
-
197
-
198
-
199
-
200
-
201
-
202
-
203
-
204
-
205
-
206
-
207
-
208
-
209
-
210
-
211
-
212
-
213
-
214
-
215
-
216
 |
 |
099
ANNUAL REPORT 2007 --- adidas Group
03
REEBOK BUSINESS PERFORMANCE In
2007
,
R
eebok made important pro
g
ress in revitaliz-
i
n
g
the brand. Wh
i
le sales were below Mana
g
e-
ment’s ex
p
ectations,
p
ro
fi
tability develo
p
ed in
l
ine with Management’s expectations.
C
urrenc
y-
n
eu
tr
al
sales for the Reebok segment were
s
table. In euro terms, th
i
s development repre-
s
ents a decrease o
f
6
%
to
€
2.
333
b
i
ll
i
on
i
n
2007
f
rom € 2.47
3
b
illion in
2006
.
O
n a like- for
-
l
ike basis, sales declined
5
%
.
The gross margin
of the Reebok se
g
ment
g
rew by
3
.
7
percenta
g
e
p
o
i
nts to
3
8.7
%
in
2
00
7 fr
o
m
35
.0
%
in
2
006
.
T
h
i
s
i
ncrease was dr
i
ven b
y
the non-recurrence
o
f
negative purchase price allocation impacts
and cost syner
g
ies from the combination of the
ad
i
das and Reebok sourc
i
n
g
act
i
v
i
t
i
es, wh
i
ch
possitively impacted the se
g
ment’s cost o
f
s
ales. In euro terms, Reebok’s gross pro
fi
t grew
4
%
t
o
€
902
mil lion in
2007
v
ers
u
s
€
8
65
m
il-
l
i
o
n in
2
006. Reebok’s operatin
g
mar
g
in
i
ncreased by
1.2
percenta
g
e po
i
nts to 4.7
%
in
200
7
f
rom
3
.
5
%
in the
p
rior year, as a result o
f
t
he positive gross margin development, which
was partly offset by higher operating expenses
as a percenta
g
e of sales. As a result, Reebok’s
operatin
g
pro
fi
t increased by 27
%
t
o
€
1
09
mil-
li
on
i
n
200
7 v
ers
u
s
€
86
mi
ll
i
on
i
n the
p
r
i
or year.
TWELVE MONTHS OF REEBOK RESULTS CONSOLIDATED
IN 2007 Several factors impact the comparison of Reebok’s
fi nancial results to the prior year. In 2006, only eleven months
were consolidated due to the acquisition date (February 1, 2006).
In 2007, twelve months of Reebok’s results were consolidated.
This had a positive impact on the comparison of Reebok segment
sales to the prior year. The segment’s gross and operating
margins, however, were negatively affected, as the month of
January is traditionally characterized by higher-than-average
clearance activities. The fi rst-time inclusion of the Greg Norman
Collection (GNC)-related sales which were generated through
Reebok’s own-retail outlets also positively affected the seg-
ment’s revenue development. These operations were excluded
from the divestiture of the
GNC business and transferred from
the TaylorMade- adidas Golf
to the Reebok segment, effective
January 1, 2007. How ever, the transfer of the NBA and Liverpool
licensed businesses to brand adidas in the fi rst half of 2006
had a negative effect on the segment’s sales development.
Purchase price allo cation charges also negatively impacted
Reebok’s results, how ever to a signifi cantly lesser extent com-
pared to the prior year.
SEGMENT SALES STABLE ON A CURRENCY-NEUTRAL BASIS
In 2007, sales for the Reebok segment were stable on a currency-
neutral basis. This development was below Management’s
initial expectation of a low-single-digit sales increase. It was
a result of the weakening market situation in Reebok’s most
important market, the USA, during 2007. While apparel reve-
nues grew, footwear and hardware sales decreased. The fi rst-
time inclusion of January, which was not consolidated in 2006
due to the timing of the acquisition, had a positive impact on
revenues. Incremental sales increases in several countries for
which Reebok had purchased the distribution rights, in partic-
ular Russia and China, also contributed to this development.
Distribution buybacks were made to better control brand
management and gain market share. see Reebok Strategy, p. 050
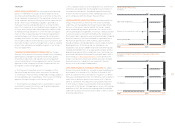
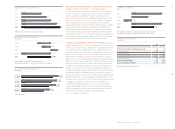
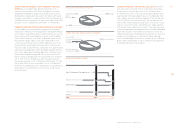
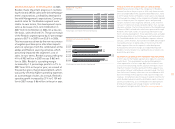
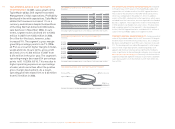
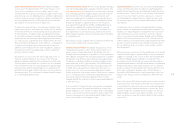
REEBOK AT A GLANCE
€
in milli
o
n
s
2
007 20061) Change
Net sales
Gross profi t
Gross margin
Operating profi t
Operating margin
1)
Only includes eleven months of the twelve-month period
.
2
,333
3
2,473 (6 %)
902
2
865 4 %
3
8.7
%
%
35.0 % 3.7 pp
109
9
86 27 %
4
.7
%
%
3.5 % 1.2 pp
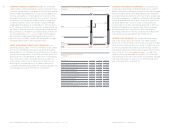
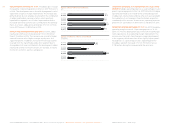
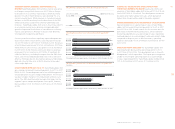
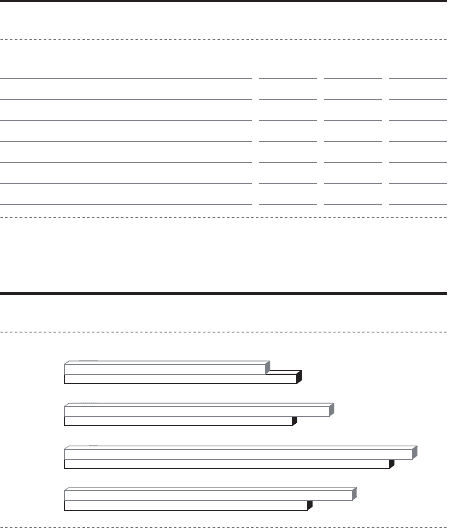
REEBOK NET SALES BY QUARTER
€
in milli
o
n
s
Q1 2006 1)
Q
1 200
7
Q2 2006
Q2
2007
Q3 2006
Q3
200
7
Q4 2006
Q
4 200
7
1)
Only includes two months of the three-month period
.
728
778
5
1
4
595
5
2
4
454
5
6
7
645