Reebok 2007 Annual Report Download - page 83
Download and view the complete annual report
Please find page 83 of the 2007 Reebok annual report below. You can navigate through the pages in the report by either clicking on the pages listed below, or by using the keyword search tool below to find specific information within the annual report.-
 1
1 -
2
-
3
-
4
-
5
-
6
-
7
-
8
-
9
-
10
-
11
-
12
-
13
-
14
-
15
-
16
-
17
-
18
-
19
-
20
-
21
-
22
-
23
-
24
-
25
-
26
-
27
-
28
-
29
-
30
-
31
-
32
-
33
-
34
-
35
-
36
-
37
-
38
-
39
-
40
-
41
-
42
-
43
-
44
-
45
-
46
-
47
-
48
-
49
-
50
-
51
-
52
-
53
-
54
-
55
-
56
-
57
-
58
-
59
-
60
-
61
-
62
-
63
-
64
-
65
-
66
-
67
-
68
-
69
-
70
-
71
-
72
-
 73
73 -
 74
74 -
 75
75 -
 76
76 -
 77
77 -
 78
78 -
 79
79 -
 80
80 -
 81
81 -
 82
82 -
 83
83 -
 84
84 -
 85
85 -
 86
86 -
 87
87 -
 88
88 -
 89
89 -
 90
90 -
 91
91 -
 92
92 -
 93
93 -
94
-
95
-
96
-
97
-
98
-
99
-
100
-
101
-
102
-
103
-
104
-
105
-
106
-
107
-
108
-
109
-
110
-
111
-
112
-
113
-
114
-
115
-
116
-
117
-
118
-
119
-
120
-
121
-
122
-
123
-
124
-
125
-
126
-
127
-
128
-
129
-
130
-
131
-
132
-
133
-
134
-
135
-
136
-
137
-
138
-
139
-
140
-
141
-
142
-
143
-
144
-
145
-
146
-
147
-
148
-
149
-
150
-
151
-
152
-
153
-
154
-
155
-
156
-
157
-
158
-
159
-
160
-
161
-
162
-
163
-
164
-
165
-
166
-
167
-
168
-
169
-
170
-
171
-
172
-
173
-
174
-
175
-
176
-
177
-
178
-
179
-
180
-
181
-
182
-
183
-
184
-
185
-
186
-
187
-
188
-
189
-
190
-
191
-
192
-
193
-
194
-
195
-
196
-
197
-
198
-
199
-
200
-
201
-
202
-
203
-
204
-
205
-
206
-
207
-
208
-
209
-
210
-
211
-
212
-
213
-
214
-
215
-
216
 |
 |

079
ANNUAL REPORT 2007 --- adidas Group
03
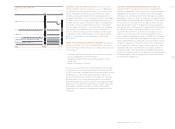
MIXED DEVELOPMENT OF GLOBAL SPORTING GOODS INDUSTRY
In 2007, the global sporting goods industry had a mixed regional
development. The European sporting goods industry was
stable, while the US market remained highly competitive. Asia
and Latin America contributed signifi cantly to our industry’s
growth.
EUROPEAN SPORTING GOODS INDUSTRY STABLE In Europe,
revenues in the largest sporting goods markets were basically
unchanged compared to the prior year. Slightly weaker sales
in Western Europe were offset by stronger sales in the region’s
emerging markets. Lower sales in Western Europe primarily
resulted from the non-recurrence of positive effects related
to the 2006 FIFA World Cup™ and a continuously diffi cult retail
landscape in the UK. Footwear sales remained stable in 2007
compared to the previous year. Apparel sales, however,
decreased at a low-single-digit rate, largely driven by the non-
recurrence of the 2006 FIFA World Cup™ jersey and replica
volumes.
From a country perspective, growth in Spain and France was
offset by promotional market conditions in other countries.
The UK market in particular saw continued contraction, with
volumes declining. Nevertheless, average prices started to
recover over the course of the year. Average selling prices for
footwear and apparel in the other countries also stabilized.
On a category basis, the European market continues to be posi-
tively infl uenced by growth in the outdoor and lifestyle catego-
ries. Running was negatively impacted by the ongoing trend
towards sport fusion styles, and the football category declined
due to the non-recurrence of positive effects related to the
2006 FIFA World Cup™. Channel develop ment was mixed.
General sporting goods stores were the major growth channel
on the footwear side, while the volume channel was the only
growth channel on the apparel side.
US SPORTING GOODS INDUSTRY HIGHLY COMPETITIVE
The sporting goods industry in North America continued to be
dominated by the shift towards new sport fusion styles. These
styles gained strongly on the back of signifi cant losses in the
classics and basketball categories.
The footwear market grew at a mid-single-digit rate in 2007.
Sales in the apparel market were largely unchanged versus
the prior year. Average selling prices increased marginally across
the industry. Sport fusion and vulcanized footwear styles in-
creased markedly. The region’s retail environment continued
to be very challenging, driven by price competition in the ath-
letic specialty channel. Retail growth was strongest in the
sporting goods and family footwear channels.
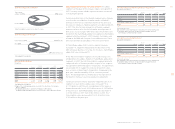
ASIAN SPORTING GOODS MARKET FLOURISHES In Asia, the
sporting goods sector grew at a high-single-digit rate in 2007.
Stagnation in Japan was more than compensated by strong
growth in the region’s emerging markets, in particular China.
In these markets, footwear sales grew at a double-digit rate
with running, basketball and training being the main contrib-
utors. Apparel sales also increased at a double-digit rate,
mainly due to growth in the training category. Average selling
prices were stable throughout the region.
LATIN AMERICAN SPORTING GOODS MARKET INCREASES
In Latin America, the sporting goods industry developed in
line with the overall economy and grew at a mid-single-digit
rate compared to the prior year. Both apparel and footwear
sales increased modestly in 2007 compared to the previous
year, refl ecting higher consumer spending in the region.
Average selling prices increased in Argentina and Venezuela
due to high infl ation rates and were stable in the region’s other
countries.
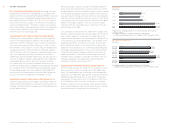
ADIDAS GROUP OUTPACES INDUSTRY AND OVERALL
ECONOMIC GROWTH In 2007, adidas Group revenues grew
faster than both the economy and the sporting goods industry
in all regions, with the exception of North America. From
a macroeconomic perspective, the two most important
indi cators of how conducive a region’s economic development
is to our business are GDP growth and consumer confi dence.
Performance in the sporting goods industry, however, is
often more infl uenced by product category trends, develop-
ment of key retail partners as well as pricing and volume
trends in the sector.
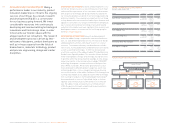
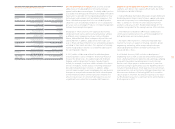
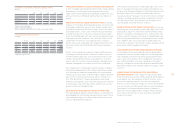
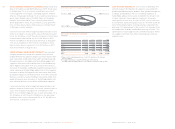
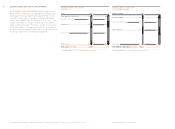
EXCHANGE RATE DEVELOPMENT 1)
€
1 equals
Average Q1 Q2 Q3 Q4
Avera
g
e
rate 2006 2007 2007 2007 2007 r
a
t
e
2007
7
USD
GBP
JPY
1
)
Spot rates at quarter-end.
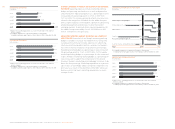
Q4 Q1 Q2 Q3 Q4
2006 2007 2007 2007 2007
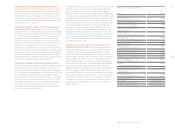
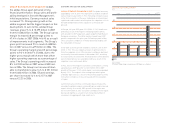
USA 1)
Euro Zone 2)
Japan 3)
1
)
Source: Conference Board
.
2) Source: Euro
p
ean Commission
.
3
) Source: Economic and Social Research Institute, Government of Ja
p
an.
1.2562 1.3318 1.3505 1.4179 1.4721
1
.
3
70
9
0.6820 0.6798 0.6740 0.6968 0.7334 0.684
5
146.08 157.32 166.63 163.55 164.93
16
1.1
9
110.0 108.2 105.3 99.5 90.6
(6) (4) (2) (6) (9)
47.3 46.7 44.3 43.9 38.9
QUARTERLY CONSUMER CONFIDENCE DEVELOPMENT
by re
gi
on