Reebok 2007 Annual Report Download - page 82
Download and view the complete annual report
Please find page 82 of the 2007 Reebok annual report below. You can navigate through the pages in the report by either clicking on the pages listed below, or by using the keyword search tool below to find specific information within the annual report.-
 1
1 -
2
-
3
-
4
-
5
-
6
-
7
-
8
-
9
-
10
-
11
-
12
-
13
-
14
-
15
-
16
-
17
-
18
-
19
-
20
-
21
-
22
-
23
-
24
-
25
-
26
-
27
-
28
-
29
-
30
-
31
-
32
-
33
-
34
-
35
-
36
-
37
-
38
-
39
-
40
-
41
-
42
-
43
-
44
-
45
-
46
-
47
-
48
-
49
-
50
-
51
-
52
-
53
-
54
-
55
-
56
-
57
-
58
-
59
-
60
-
61
-
62
-
63
-
64
-
65
-
66
-
67
-
68
-
69
-
70
-
71
-
 72
72 -
 73
73 -
 74
74 -
 75
75 -
 76
76 -
 77
77 -
 78
78 -
 79
79 -
 80
80 -
 81
81 -
 82
82 -
 83
83 -
 84
84 -
 85
85 -
 86
86 -
 87
87 -
 88
88 -
 89
89 -
 90
90 -
 91
91 -
 92
92 -
93
-
94
-
95
-
96
-
97
-
98
-
99
-
100
-
101
-
102
-
103
-
104
-
105
-
106
-
107
-
108
-
109
-
110
-
111
-
112
-
113
-
114
-
115
-
116
-
117
-
118
-
119
-
120
-
121
-
122
-
123
-
124
-
125
-
126
-
127
-
128
-
129
-
130
-
131
-
132
-
133
-
134
-
135
-
136
-
137
-
138
-
139
-
140
-
141
-
142
-
143
-
144
-
145
-
146
-
147
-
148
-
149
-
150
-
151
-
152
-
153
-
154
-
155
-
156
-
157
-
158
-
159
-
160
-
161
-
162
-
163
-
164
-
165
-
166
-
167
-
168
-
169
-
170
-
171
-
172
-
173
-
174
-
175
-
176
-
177
-
178
-
179
-
180
-
181
-
182
-
183
-
184
-
185
-
186
-
187
-
188
-
189
-
190
-
191
-
192
-
193
-
194
-
195
-
196
-
197
-
198
-
199
-
200
-
201
-
202
-
203
-
204
-
205
-
206
-
207
-
208
-
209
-
210
-
211
-
212
-
213
-
214
-
215
-
216
 |
 |
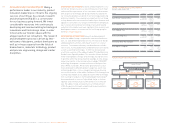
078
ANNUAL REPORT 2007 --- adidas Group GROUP MANAGEMENT REPORT – OUR FINANCIAL YEAR -- Group Business Performance - Economic and Sector Development
E
CONOMIC AND SECTOR DEVELOPMENT
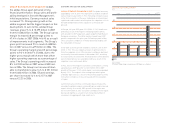
GLOBAL ECONOMIC EXPANSION SLOWS The global economy
expanded by 3.6 % in 2007. This represents a modest slowdown
versus the prior year (2006: 3.8 %). Following strong increases
in the fi rst six months of the year, turbulence on inter national
capital and credit markets resulting from the subprime crisis in
the USA dampened economic expansion as the year pro-
gressed.
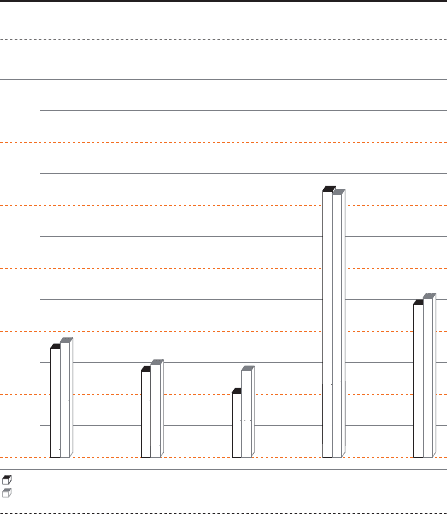
In Europe, full year GDP grew 2.9 % (2006: 3.1 %). Growth was
primarily a result of the region’s emerging markets which,
with around 6 % GDP expansion, again outperformed Western
European economies. The latter mainly showed lower GDP
growth compared to the prior year. Following a peak in May
2007, consumer confi dence in the EU declined steadily over
the remainder of the year.
In the USA, economic growth slowed to a level of 2.2 % in 2007
(2006: 2.9 %). This was largely a result of spillover effects
from the subprime crisis. US consumer confi dence declined
consistently from mid-summer to November 2007, reaching
its lowest level since late 2005. The main drivers of this decline
were rising oil prices, less available credit as a result of the
subprime issue, and a weak dollar.
In Asia, most of the region’s economies continued on a strong
upswing. Asia’s GDP grew 8.6 % in 2007 (2006: 8.5 %). GDP
growth in China was 11.5 %, while Japan’s economy expanded
by only 1.9 %. The region’s other emerg ing markets grew
at double-digit rates as a result of fl ourishing export activity.
Consumer confi dence in Asia increased, with the exception
of Japan.
Latin Ameri can eco nomies con tinued to be positively infl u-
enced by the global surge in commodity prices and increased
export activity. As a result, GDP growth in the region was
5.0 % in 2007 (2006: 5.2 %). Consumer confi dence in the region
decreased slightly as a result of an increasing number of
consumers struggling with high credit costs.
GROUP BUSINESS PERFORMANCE In
200
7,
the adidas Group a
g
ain delivered stron
g
fi
nancial performance.
G
roup sales and profi t-
a
b
i
l
i
ty developed
i
n l
i
ne w
i
th Manage ment’s
initial ex
p
ectations.
C
urrency-neutral sales
in
c
r
eased
7
%
. Strong sales growth in the
a
d
i
das se
g
ment had the b
igg
est
i
mpact on th
i
s
d
evelo
p
ment. In euro terms, adidas
G
rou
p
re
v
en
u
es
gre
w2
%
t
o
€
1
0
.
299
billion in
200
7
f
rom € 10.084 billion in 2006. The Group’s gross
mar
g
in increased
2
.
8
percenta
g
e points to
4
7.4
%
o
f
sa
l
es
in 2
007
(
2
006: 44.6
%
)
as a result
o
f improvements in all segments. The
G
roup’s
g
ross pro
fi
t increased
9
%
to reach
€
4.
882
b
il
-
l
i
o
n in 200
7
v
e
r
sus
€
4.49
5
b
illi
o
n in
2
00
6
.
The
Group’s operatin
g
mar
g
in
g
rew
0
.
5
percenta
g
e
p
o
i
nts to 9.2
%
f
rom
8
.7
%
in
2006
,
d
ue to t
h
e
higher gross margin which more than o
ff
set
higher operating expenses as a percentage o
f
s
ales. The Group’s operatin
g
profi t increased
8
%
t
o
€
949 m
i
ll
io
n
i
n2
007
v
e
r
sus
€
881
mil
-
li
on
i
n
2006
. The
G
rou
p
’s net income attribut
-
a
ble to shareholders grew 14
%
t
o
€
551 million
f
r
o
m€ 48
3
milli
o
n in 200
6
. Diluted earnings
per share
i
ncreased 14
%
t
o
€ 2.
57
i
n2007
versus
€
2
.
25
in
2006
.
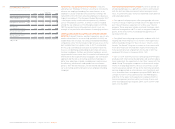
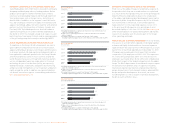
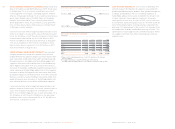
REGIONAL GDP DEVELOPMENT 1)
in
%
Latin
Global Europe USA Asia America
01
0
00
8
00
6
00
4
00
2
00
0
2007
200
6
Source: Allianz
.
1)
Real, percenta
g
e chan
g
e versus prior year; 2007 fi
g
ures are estimated.