Reebok 2007 Annual Report Download - page 61
Download and view the complete annual report
Please find page 61 of the 2007 Reebok annual report below. You can navigate through the pages in the report by either clicking on the pages listed below, or by using the keyword search tool below to find specific information within the annual report.-
 1
1 -
2
-
3
-
4
-
5
-
6
-
7
-
8
-
9
-
10
-
11
-
12
-
13
-
14
-
15
-
16
-
17
-
18
-
19
-
20
-
21
-
22
-
23
-
24
-
25
-
26
-
27
-
28
-
29
-
30
-
31
-
32
-
33
-
34
-
35
-
36
-
37
-
38
-
39
-
40
-
41
-
42
-
43
-
44
-
45
-
46
-
47
-
48
-
49
-
50
-
 51
51 -
 52
52 -
 53
53 -
 54
54 -
 55
55 -
 56
56 -
 57
57 -
 58
58 -
 59
59 -
 60
60 -
 61
61 -
 62
62 -
 63
63 -
 64
64 -
 65
65 -
 66
66 -
 67
67 -
 68
68 -
 69
69 -
 70
70 -
 71
71 -
72
-
73
-
74
-
75
-
76
-
77
-
78
-
79
-
80
-
81
-
82
-
83
-
84
-
85
-
86
-
87
-
88
-
89
-
90
-
91
-
92
-
93
-
94
-
95
-
96
-
97
-
98
-
99
-
100
-
101
-
102
-
103
-
104
-
105
-
106
-
107
-
108
-
109
-
110
-
111
-
112
-
113
-
114
-
115
-
116
-
117
-
118
-
119
-
120
-
121
-
122
-
123
-
124
-
125
-
126
-
127
-
128
-
129
-
130
-
131
-
132
-
133
-
134
-
135
-
136
-
137
-
138
-
139
-
140
-
141
-
142
-
143
-
144
-
145
-
146
-
147
-
148
-
149
-
150
-
151
-
152
-
153
-
154
-
155
-
156
-
157
-
158
-
159
-
160
-
161
-
162
-
163
-
164
-
165
-
166
-
167
-
168
-
169
-
170
-
171
-
172
-
173
-
174
-
175
-
176
-
177
-
178
-
179
-
180
-
181
-
182
-
183
-
184
-
185
-
186
-
187
-
188
-
189
-
190
-
191
-
192
-
193
-
194
-
195
-
196
-
197
-
198
-
199
-
200
-
201
-
202
-
203
-
204
-
205
-
206
-
207
-
208
-
209
-
210
-
211
-
212
-
213
-
214
-
215
-
216
 |
 |
057
ANNUAL REPORT 2007 --- adidas Group
02
1)
Excluding goodwill and fi nance leases.
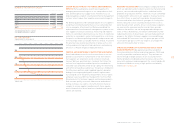
OPERATING MARGIN AS KEY PERFORMANCE INDICATOR
OF OPERATIONAL PROGRESS Operating margin (defi ned as
operating profi t as a percentage of net sales) is our Group’s
most important measure of operational success. It highlights
the quality of our top-line and operational effi ciency. The
primary drivers central to enhancing operating margin are:
- Sales and gross margin development: Management focuses
on identifying and exploiting opportunities that not only pro-
vide for future growth, but also have potential to increase gross
margin (defi ned as gross profi t as a percentage of net sales).
Major levers for sustaining and enhancing our Group’s sales
and gross margin include optimizing our product mix,
increasing the quality of distribution – with a particular focus
on controlled space – as well as supply chain effi ciency initia-
tives, and the minimization of clearance activities.
- Operating expense control: Tight control of operating
expenses is particularly important as we strive to leverage the
Group’s sales growth through to the bottom line. Marketing
working budget is our largest operating expense. It is one of
the most important mechanisms for driving top-line growth.
Therefore, we are committed to improving the utilization of
our marketing spend. This includes concentrating our commu-
nication efforts (including advertising, retail presentation and
public relations) on key global brand initiatives and focusing
our promotion spend on well-selected partnerships with top
events, leagues, clubs and athletes. We also aim to increase
operational effi ciency and reduce operating overhead expen ses
as a percentage of sales. Refi ning business proc esses, elimi-
nating redundancies and leveraging the scale of our orga-
nization are important drivers in this respect.
We strive to maximize revenues and minimize costs by detailed
target setting, and we constantly monitor deviations in rolling
forecasts on a monthly basis. If necessary, action plans are
implemented to optimize the development of the Group’s oper-
ating performance.
OPTIMIZATION OF NON-OPERATING COMPONENTS Our Group
also puts a high priority on the optimization of non-operating
components such as fi nancial expenses and taxes, as these
items strongly impact the Group’s cash outfl ows and therefore
the Group’s free cash fl ow. Financial expenses are managed
centrally by our Group Treasury department. see Treasury, p. 091
The Group’s current and future tax expenditures are optimized
globally by our Group Taxes department.
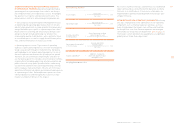
KEY FINANCIAL METRICS
Gross margin = Gross profi t
Net sales × 100
Operating margin = Operating profi t
Net sales × 100
Average operating
working capital =
Sum of operating working
capital at quarter-end
4
Operating working capital
in % of net sales =
Average operating
working capital
Net sales × 100
Capital expenditure1) =
Additions of property,
plant and equipment plus
intangible assets