Reebok 2007 Annual Report Download - page 93
Download and view the complete annual report
Please find page 93 of the 2007 Reebok annual report below. You can navigate through the pages in the report by either clicking on the pages listed below, or by using the keyword search tool below to find specific information within the annual report.-
 1
1 -
2
-
3
-
4
-
5
-
6
-
7
-
8
-
9
-
10
-
11
-
12
-
13
-
14
-
15
-
16
-
17
-
18
-
19
-
20
-
21
-
22
-
23
-
24
-
25
-
26
-
27
-
28
-
29
-
30
-
31
-
32
-
33
-
34
-
35
-
36
-
37
-
38
-
39
-
40
-
41
-
42
-
43
-
44
-
45
-
46
-
47
-
48
-
49
-
50
-
51
-
52
-
53
-
54
-
55
-
56
-
57
-
58
-
59
-
60
-
61
-
62
-
63
-
64
-
65
-
66
-
67
-
68
-
69
-
70
-
71
-
72
-
73
-
74
-
75
-
76
-
77
-
78
-
79
-
80
-
81
-
82
-
 83
83 -
 84
84 -
 85
85 -
 86
86 -
 87
87 -
 88
88 -
 89
89 -
 90
90 -
 91
91 -
 92
92 -
 93
93 -
 94
94 -
 95
95 -
 96
96 -
 97
97 -
 98
98 -
 99
99 -
 100
100 -
 101
101 -
 102
102 -
 103
103 -
104
-
105
-
106
-
107
-
108
-
109
-
110
-
111
-
112
-
113
-
114
-
115
-
116
-
117
-
118
-
119
-
120
-
121
-
122
-
123
-
124
-
125
-
126
-
127
-
128
-
129
-
130
-
131
-
132
-
133
-
134
-
135
-
136
-
137
-
138
-
139
-
140
-
141
-
142
-
143
-
144
-
145
-
146
-
147
-
148
-
149
-
150
-
151
-
152
-
153
-
154
-
155
-
156
-
157
-
158
-
159
-
160
-
161
-
162
-
163
-
164
-
165
-
166
-
167
-
168
-
169
-
170
-
171
-
172
-
173
-
174
-
175
-
176
-
177
-
178
-
179
-
180
-
181
-
182
-
183
-
184
-
185
-
186
-
187
-
188
-
189
-
190
-
191
-
192
-
193
-
194
-
195
-
196
-
197
-
198
-
199
-
200
-
201
-
202
-
203
-
204
-
205
-
206
-
207
-
208
-
209
-
210
-
211
-
212
-
213
-
214
-
215
-
216
 |
 |
089
ANNUAL REPORT 2007 --- adidas Group
03
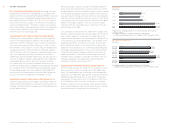
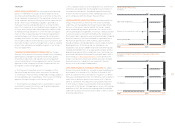
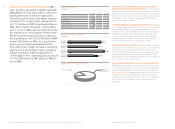
TOTAL ASSETS DECREASE 1 % At the end of 2007, total assets
decreased 1 % to € 8.325 billion versus € 8.379 billion in the
prior year, mainly due to currency effects which had a negative
impact on the Group’s US dollar-denominated assets.
INVENTORIES UP 1 % Group inventories increased 1 % to
€ 1.629 billion at the end of 2007 versus € 1.607 billion in 2006.
On a currency-neutral basis, inventories grew 7 %. The
increase was driven by higher inventory levels in emerging
markets, refl ecting the Group’s high sales growth expectations
for these countries in particular.
RECEIVABLES INCREASE 3 % At the end of 2007, Group receiv-
ables increased 3 % to € 1.459 billion (2006: € 1.415 billion).
On a currency-neutral basis, receivables grew 8 %. This is well
below sales growth in the fourth quarter of 2007 and refl ects
strict discipline in the Group’s trade terms management and
concerted collection efforts in all segments.
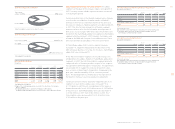
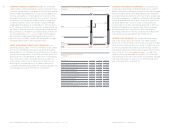
OTHER CURRENT ASSETS UP 28 % Other current assets
increased 28 % to € 529 million at the end of 2007 from
€ 413 million in 2006. This development was mainly due
to higher prepayments for promotion contracts and higher
fair values of fi nancial instruments.
FIXED ASSETS DECREASE 7 % Fixed assets decreased by
7 % to € 3.726 billion at the end of 2007 versus € 3.988 billion
in 2006. This was mainly due to € 286 million of negative
currency trans lation effects on fi xed assets held in currencies
other than the euro. In addition, the transfer of € 17 million of
fi xed assets to assets held-for-sale impacted this development.
Additions of € 295 million were partly offset by depreciation and
amortization of € 215 million as well as disposals in an amount
of € 37 million.
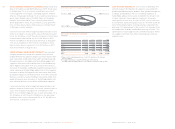
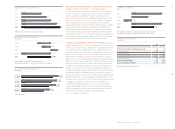
ASSETS HELD-FOR-SALE INCREASE 35 % Assets held-for-
sale mainly relate to the planned sale of land and buildings
in Herzogenaurach, Germany. In addition, two warehouses in
the UK and the Maxfl i trademark were reclassifi ed as assets
held-for-sale at the end of 2007. The Maxfl i trademark was
sold in February 2008. see Subsequent Events, p. 117 As a result
of these additions, assets held-for-sale increased 35 % to
€ 80 million (2006: € 59 million).
OTHER NON-CURRENT ASSETS INCREASE 8 % Other non-
current assets increased by 8 % to € 147 million at the end of
2007 from € 134 million in 2006, mainly driven by higher fair
values of fi nancial instruments.
ACCOUNTS PAYABLE UP 13 % Accounts payable increased
13 % to € 849 million at the end of 2007 versus € 752 million
in 2006. On a currency-neutral basis, accounts payable were
up 22 %. The increase is primarily due to increased product
deliveries from suppliers in the last quarter of the year,
refl ecting the Group’s sales growth expectations.
OTHER CURRENT LIABILITIES GROW 15 % Other current lia -
bilities increased 15 % to € 266 million at the end of 2007 from
€ 232 million in 2006, primarily as a result of increased current
forward contracts.
OTHER NON-CURRENT LIABILITIES INCREASE 65 % Other
non-current liabilities increased 65 % to € 69 million at the
end of 2007 from € 43 million in 2006, primarily as a result of
increased non-current forward contracts.
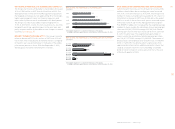
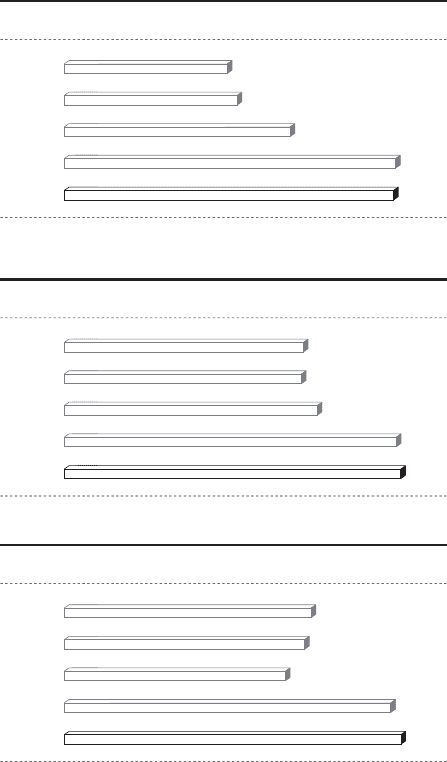
TOTAL ASSETS
€
in million
s
INVENTORIES
€ in million
s
RECEIVABLES
€
in milli
o
n
s
2003
2004 1)
2005
2006 2)
2007
1
) Restated due to a
pp
lication of amendment to IAS 19
.
2) Includin
g
Reebok business se
g
ment from February 1, 2006 onwards.
2003
2004
2005
2006 1)
2007
1
) Including Reebok business segment from February 1, 2006 onwards.
2003
2004
2005
2006 1)
2007
1
) Including Reebok business segment from February 1, 2006 onwards.
4,434
1,155
1,046
5,750
1,230
965
8,379
1,607
1,415
8
,
3
25
1
,
629
1
,
45
9
4,188
1,164
1,075