Reebok 2007 Annual Report Download - page 206
Download and view the complete annual report
Please find page 206 of the 2007 Reebok annual report below. You can navigate through the pages in the report by either clicking on the pages listed below, or by using the keyword search tool below to find specific information within the annual report.-
 1
1 -
2
-
3
-
4
-
5
-
6
-
7
-
8
-
9
-
10
-
11
-
12
-
13
-
14
-
15
-
16
-
17
-
18
-
19
-
20
-
21
-
22
-
23
-
24
-
25
-
26
-
27
-
28
-
29
-
30
-
31
-
32
-
33
-
34
-
35
-
36
-
37
-
38
-
39
-
40
-
41
-
42
-
43
-
44
-
45
-
46
-
47
-
48
-
49
-
50
-
51
-
52
-
53
-
54
-
55
-
56
-
57
-
58
-
59
-
60
-
61
-
62
-
63
-
64
-
65
-
66
-
67
-
68
-
69
-
70
-
71
-
72
-
73
-
74
-
75
-
76
-
77
-
78
-
79
-
80
-
81
-
82
-
83
-
84
-
85
-
86
-
87
-
88
-
89
-
90
-
91
-
92
-
93
-
94
-
95
-
96
-
97
-
98
-
99
-
100
-
101
-
102
-
103
-
104
-
105
-
106
-
107
-
108
-
109
-
110
-
111
-
112
-
113
-
114
-
115
-
116
-
117
-
118
-
119
-
120
-
121
-
122
-
123
-
124
-
125
-
126
-
127
-
128
-
129
-
130
-
131
-
132
-
133
-
134
-
135
-
136
-
137
-
138
-
139
-
140
-
141
-
142
-
143
-
144
-
145
-
146
-
147
-
148
-
149
-
150
-
151
-
152
-
153
-
154
-
155
-
156
-
157
-
158
-
159
-
160
-
161
-
162
-
163
-
164
-
165
-
166
-
167
-
168
-
169
-
170
-
171
-
172
-
173
-
174
-
175
-
176
-
177
-
178
-
179
-
180
-
181
-
182
-
183
-
184
-
185
-
186
-
187
-
188
-
189
-
190
-
191
-
192
-
193
-
194
-
195
-
 196
196 -
 197
197 -
 198
198 -
 199
199 -
 200
200 -
 201
201 -
 202
202 -
 203
203 -
 204
204 -
 205
205 -
 206
206 -
 207
207 -
 208
208 -
 209
209 -
 210
210 -
 211
211 -
 212
212 -
 213
213 -
 214
214 -
 215
215 -
 216
216
 |
 |
202
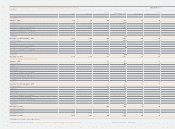
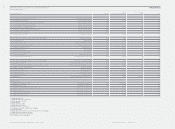
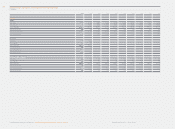
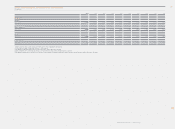
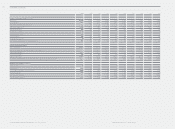
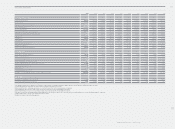
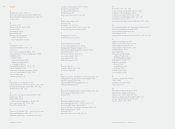
ANNUAL REPORT 2007 --- adidas Group CONSOLIDATED FINANCIAL STATEMENTS - Ten-Year Overview
TEN-YEAR OVERVIEW
200
7 2006)1) 2005 2004 2003 2002 2001 2000 1999 1998)2)
In
co
m
e
S
t
a
t
e
m
e
nt D
a
t
a
(
€ in millions
)
Net sales 3)
Gross profi t 3)
Royalty and commission income 3)
Operating expenses 3)
Operating profi t 3) 4)
Financial result 3) 5)
Income before taxes 3) 5)
Income taxes 3)
Minority interests 3) 5)
Net income attributable to shareholders 6)
In
co
m
e
S
t
a
t
e
m
e
nt R
a
ti
os
Gross margin 3)
Operating expenses as a percentage of net sales 3)
Operating margin 3) 4)
Interest coverage 3)
Effective tax rate 3)
Net income attributable to shareholders as a percentage of net sales 6)
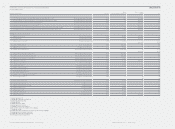
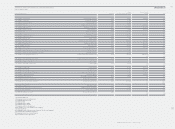
Balance
S
heet Data
(
€ in millions
)
Total assets 5)
Inventories
Receivables and other current assets
Working capital 5)
Net total borrowings
Shareholders’ equity 5)
10
,
29
9
10,084 6,636 5,860 6,267 6,523 6,112 5,835 5,354 5,065
4,
882
4,495 3,197 2,813 2,814 2,819 2,601 2,528 2,352 2,124
102
90 47 42 42 46 42 43 35 45
4,035 3,704 2,537 2,236 2,324 2,343 2,126 2,091 1,870 1,698
949
881 707 584 490 477 475 437 482 416
(
135
)
(158) (52) (59) (49) (87) (102) (94) (84) (115)
8
15 723 655 526 438 390 376 347 398 319
2
6
0
227 221 193 167 148 147 140 153 105
(
4
)
(13) (8) (7) (11) (14) (21) (25) (18) (9)
551
483 383 314 260 229 208 182 228 205
47.4 % 44.6 % 48.2 % 48.0 % 44.9 % 43.2 % 42.6 % 43.3 % 43.9 % 41.9 %
3
9.2
%
36.7 % 38.2 % 38.2 % 37.1 % 35.9 % 34.8 % 35.8 % 34.9 % 33.5 %
9.2
%
8.7 % 10.7 % 10.0 % 7.8 % 7.3 % 7.8 % 7.5 % 9.0 % 8.2 %
6
.
8
5.9 18.4 10.2 8.4 6.4 4.9 4.6 6.1 4.8
3
1.8
%
31.4 % 33.7 % 36.7 % 38.0 % 37.9 % 39.0 % 40.3 % 38.4 % 33.0 %
5
.4
%
4.8 % 5.8 % 5.4 % 4.2 % 3.5 % 3.4 % 3.1 % 4.3 % 4.0 %
8,3
25 8,379 5,750 4,434 4,188 4,261 4,183 4,018 3,587 3,206
1
,
6
29
1,607 1,230 1,155 1,164 1,190 1,273 1,294 1,045 975
2
,
0
4
9
1,913 1,551 1,425 1,335 1,560 1,520 1,387 1,234 1,026
1,
70
8
1,733 2,644 1,336 1,433 1,445 1,485 1,417 1,096 (327)
1,766
2,231 (551) 665 1,018 1,498 1,679 1,791 1,591 1,655
3
,02
3
2,828 2,684 1,544 1,285 1,081 1,015 815 680 463