Reebok 2007 Annual Report Download - page 207
Download and view the complete annual report
Please find page 207 of the 2007 Reebok annual report below. You can navigate through the pages in the report by either clicking on the pages listed below, or by using the keyword search tool below to find specific information within the annual report.-
 1
1 -
2
-
3
-
4
-
5
-
6
-
7
-
8
-
9
-
10
-
11
-
12
-
13
-
14
-
15
-
16
-
17
-
18
-
19
-
20
-
21
-
22
-
23
-
24
-
25
-
26
-
27
-
28
-
29
-
30
-
31
-
32
-
33
-
34
-
35
-
36
-
37
-
38
-
39
-
40
-
41
-
42
-
43
-
44
-
45
-
46
-
47
-
48
-
49
-
50
-
51
-
52
-
53
-
54
-
55
-
56
-
57
-
58
-
59
-
60
-
61
-
62
-
63
-
64
-
65
-
66
-
67
-
68
-
69
-
70
-
71
-
72
-
73
-
74
-
75
-
76
-
77
-
78
-
79
-
80
-
81
-
82
-
83
-
84
-
85
-
86
-
87
-
88
-
89
-
90
-
91
-
92
-
93
-
94
-
95
-
96
-
97
-
98
-
99
-
100
-
101
-
102
-
103
-
104
-
105
-
106
-
107
-
108
-
109
-
110
-
111
-
112
-
113
-
114
-
115
-
116
-
117
-
118
-
119
-
120
-
121
-
122
-
123
-
124
-
125
-
126
-
127
-
128
-
129
-
130
-
131
-
132
-
133
-
134
-
135
-
136
-
137
-
138
-
139
-
140
-
141
-
142
-
143
-
144
-
145
-
146
-
147
-
148
-
149
-
150
-
151
-
152
-
153
-
154
-
155
-
156
-
157
-
158
-
159
-
160
-
161
-
162
-
163
-
164
-
165
-
166
-
167
-
168
-
169
-
170
-
171
-
172
-
173
-
174
-
175
-
176
-
177
-
178
-
179
-
180
-
181
-
182
-
183
-
184
-
185
-
186
-
187
-
188
-
189
-
190
-
191
-
192
-
193
-
194
-
195
-
196
-
 197
197 -
 198
198 -
 199
199 -
 200
200 -
 201
201 -
 202
202 -
 203
203 -
 204
204 -
 205
205 -
 206
206 -
 207
207 -
 208
208 -
 209
209 -
 210
210 -
 211
211 -
 212
212 -
 213
213 -
 214
214 -
 215
215 -
 216
216
 |
 |
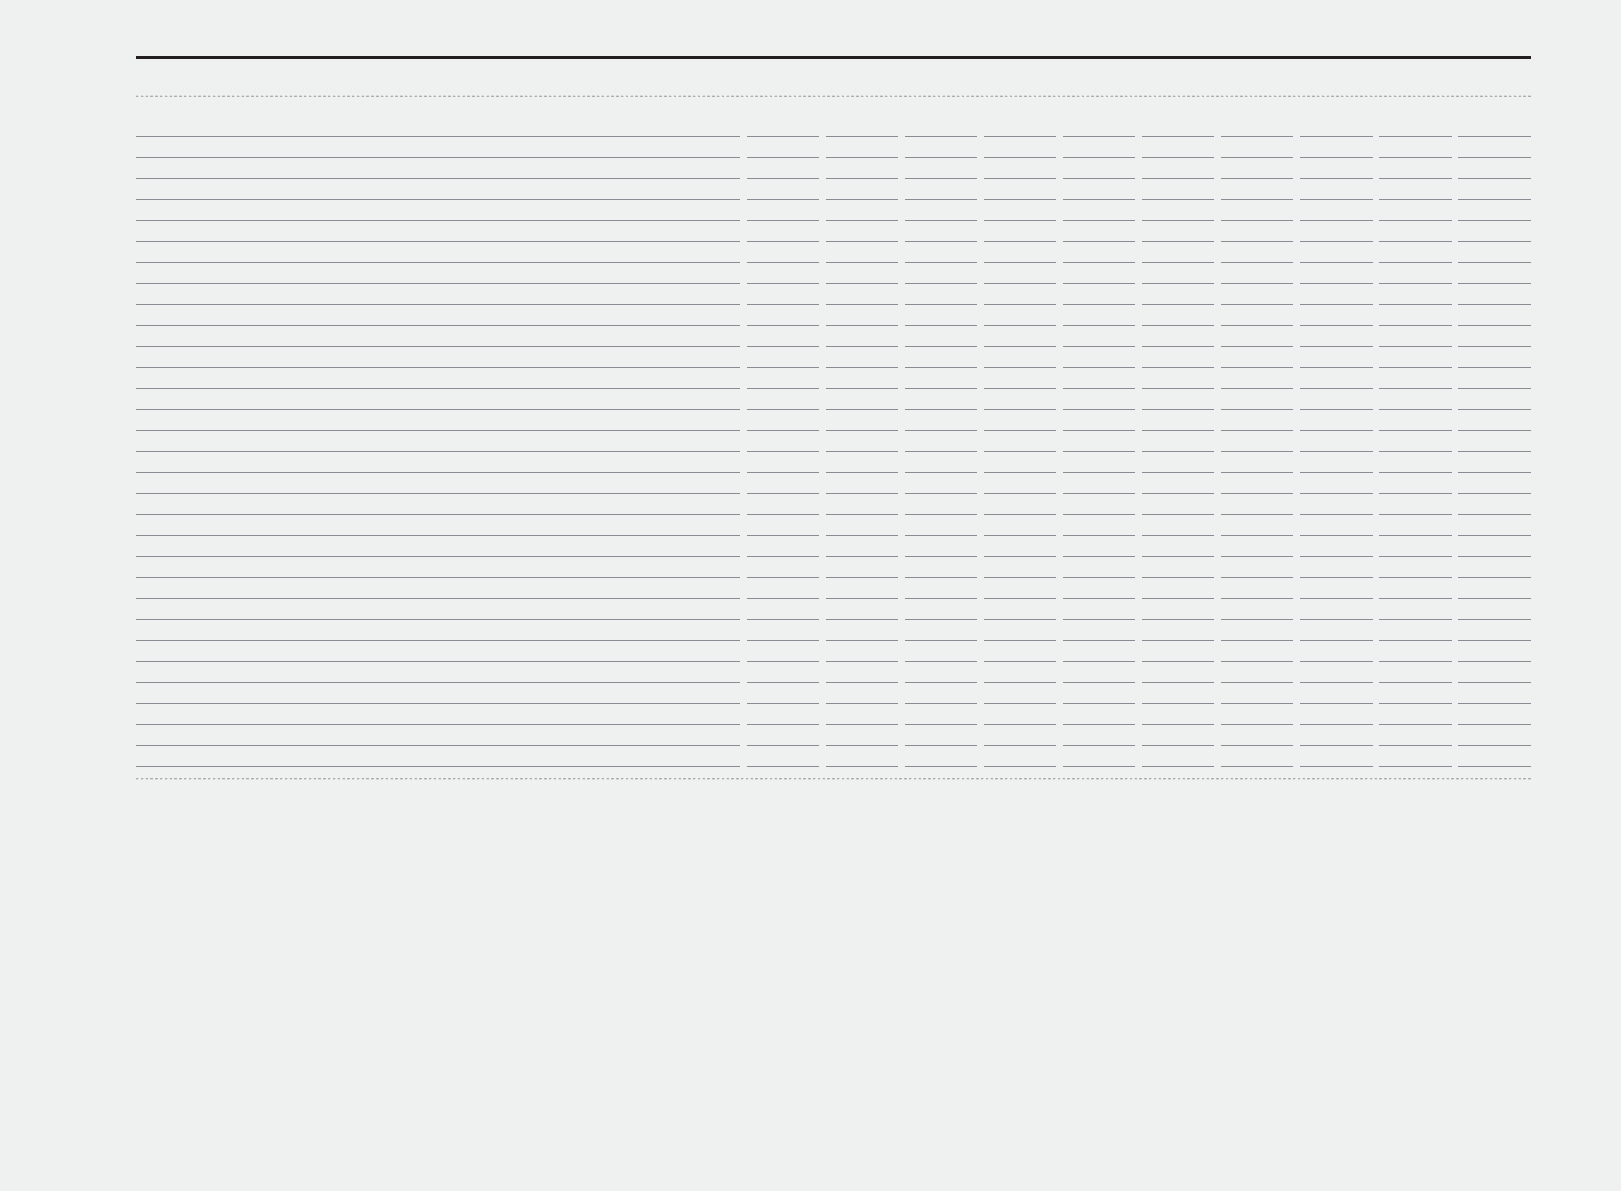
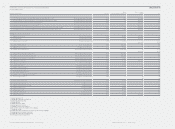
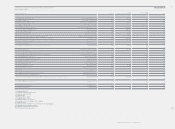
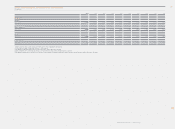
203
ANNUAL REPORT 2007 --- adidas Group
200
7 2006)
1) 2005 2004 2003 2002 2001 2000 1999 1998)
2)
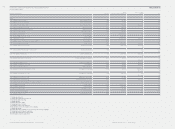
Balance Sheet Ratios
Financial leverage 5)
Equity ratio 5)
Equity-to-fi xed-assets ratio 5)
Asset coverage I 5)
Asset coverage II 5)
Fixed asset intensity of investments
Current asset intensity of investments
Liquidity I 5)
Liquidity II 5)
Liquidity III 5)
Working capital turnover 5)
Return on equity 5) 6)
Return on capital employed 5) 6)
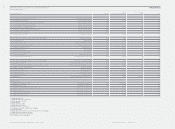
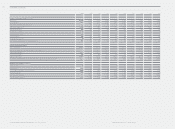
Data Per Share7
)
Share price at year-end (in €)
Basic earnings 6) (in €)
Diluted earnings 6) (in €)
Price / earnings ratio at year-end
Market capitalization at year-end (€ in millions)
Operating cash fl ow (in €)
Dividend (in €)
Dividend payout ratio (in %)
Number of outstanding shares at year-end (in thousands)
Em
p
loyees
Number of employees at year-end 3)
Personnel expenses 3) (€ in millions)
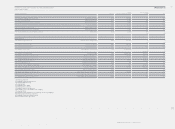
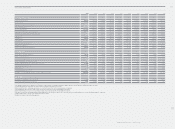
1) Including Reebok business segment from February 1, 2006 onwards. Including Greg Norman apparel business from February 1, 2006 to November 30, 2006
.
2) Consolidated fi nancial statements for 1998 include the Salomon group for the fi rst time
.
3
) 2004 and 2005 refl ect continuin
g
operations as a result of the divestiture of the Salomon business se
g
ment
.
4
)
Operatin
g
profi t fi
g
ures prior to 2004 exclude royalty and commission income and
g
oodwill amortization
.
5)
2003 and 2004 fi gures have been restated due to application of IAS 32 / IAS 39 and amendment to IAS 19.
6
) Includes income from continuing and discontinued operations. In 1998 before special effect of € 369 million for acquired in-process research and development – expensed
.
7) Fi
g
ures adjusted for 1: 4 share split conducted on June 6, 2006
.
8
)
Subject to Annual General Meetin
g
approval.
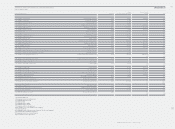
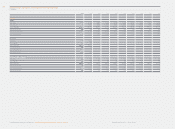
TEN-YEAR OVERVIEW
5
8.4
%
78.9 % (20.5 %) 43.1 % 79.2 % 138.5 % 165.5 % 219.6 % 234.0 % 357.2 %
3
6.3 % 33.8 % 46.7 % 34.8 % 30.7 % 25.4 % 24.3 % 20.3 % 19.0 % 14.4 %
72.2
%
63.5 % 194.0 % 110.4 % 91.1 % 75.4 % 77.8 % 66.2 % 54.9 % 40.2 %
1
40.
5
%
138.7 % 284.1 % 194.1 % 197.6 % 196.9 % 209.3 % 207.7 % 183.4 % 68.3 %
1
01.2 % 102.0 % 150.4 % 106.3 % 108.3 % 107.6 % 105.9 % 101.3 % 99.5 % 37.0 %
5
0.
3
%
53.2 % 24.1 % 31.6 % 33.7 % 33.7 % 31.2 % 30.7 % 34.5 % 36.0 %
49.7
%
46.8 % 75.9 % 68.4 % 66.3 % 66.3 % 68.8 % 69.3 % 65.5 % 64.0 %
15.7 % 15.8 % 92.0 % 26.8 % 20.8 % 5.5 % 6.1 % 7.7 % 5.5 % 2.2 %
7
5
.7
%
80.4 % 148.0 % 88.4 % 100.8 % 99.1 % 96.0 % 90.4 % 88.0 % 35.9 %
1
42.8
%
153.7 % 219.4 % 156.4 % 187.4 % 185.3 % 187.4 % 185.0 % 171.5 % 76.8 %
6
.
0
5.8 2.6 4.4 4.4 4.5 4.1 4.1 4.9 (15.5)
18.2
%
17.1 % 14.3 % 20.4 % 20.2 % 21.1 % 20.5 % 22.3 % 33.5 % 44.2 %
20.2
%
17.6 % 49.3 % 27.5 % 22.1 % 16.8 % 16.7 % 17.0 % 20.7 % 20.5 %
5
1.2
6
37.73 40.00 29.69 22.58 20.58 21.08 16.50 18.58 23.78
2.71
2.37 2.05 1.72 1.43 1.26 1.15 1.00 1.26 1.13
2
.
5
7 2.25 1.93 1.64 1.43 1.26 1.15 1.00 1.26 1.13
2
0
.
0
16.8 20.7 18.1 15.8 16.3 18.3 16.5 14.8 20.1
10
,
438 7,679 8,122 5,446 4,104 3,738 3,823 2,993 3,381 4,123
3
.8
3
3.74 1.88 3.17 3.58 2.94 2.12 (0.06) 1.81 0.66
0
.
50
)
8
8)
0.42 0.33 0.33 0.25 0.25 0.23 0.23 0.23 0.21
15
.
5
17.7 17.2 18.9 17.5 19.8 20.0 22.9 18.3 18.6
20
3
.629 203.537 203.047 183.436 181.816 181.692 181.396 181.396 181.396 181.396
3
1
,3
4
4
26,376 15,935 14,254 15,686 14,716 13,941 13,362 12,829 12,036
1
,22
1
1,087 706 637 709 758 695 630 580 513
05