Reebok 2007 Annual Report Download - page 165
Download and view the complete annual report
Please find page 165 of the 2007 Reebok annual report below. You can navigate through the pages in the report by either clicking on the pages listed below, or by using the keyword search tool below to find specific information within the annual report.-
 1
1 -
2
-
3
-
4
-
5
-
6
-
7
-
8
-
9
-
10
-
11
-
12
-
13
-
14
-
15
-
16
-
17
-
18
-
19
-
20
-
21
-
22
-
23
-
24
-
25
-
26
-
27
-
28
-
29
-
30
-
31
-
32
-
33
-
34
-
35
-
36
-
37
-
38
-
39
-
40
-
41
-
42
-
43
-
44
-
45
-
46
-
47
-
48
-
49
-
50
-
51
-
52
-
53
-
54
-
55
-
56
-
57
-
58
-
59
-
60
-
61
-
62
-
63
-
64
-
65
-
66
-
67
-
68
-
69
-
70
-
71
-
72
-
73
-
74
-
75
-
76
-
77
-
78
-
79
-
80
-
81
-
82
-
83
-
84
-
85
-
86
-
87
-
88
-
89
-
90
-
91
-
92
-
93
-
94
-
95
-
96
-
97
-
98
-
99
-
100
-
101
-
102
-
103
-
104
-
105
-
106
-
107
-
108
-
109
-
110
-
111
-
112
-
113
-
114
-
115
-
116
-
117
-
118
-
119
-
120
-
121
-
122
-
123
-
124
-
125
-
126
-
127
-
128
-
129
-
130
-
131
-
132
-
133
-
134
-
135
-
136
-
137
-
138
-
139
-
140
-
141
-
142
-
143
-
144
-
145
-
146
-
147
-
148
-
149
-
150
-
151
-
152
-
153
-
154
-
 155
155 -
 156
156 -
 157
157 -
 158
158 -
 159
159 -
 160
160 -
 161
161 -
 162
162 -
 163
163 -
 164
164 -
 165
165 -
 166
166 -
 167
167 -
 168
168 -
 169
169 -
 170
170 -
 171
171 -
 172
172 -
 173
173 -
 174
174 -
 175
175 -
176
-
177
-
178
-
179
-
180
-
181
-
182
-
183
-
184
-
185
-
186
-
187
-
188
-
189
-
190
-
191
-
192
-
193
-
194
-
195
-
196
-
197
-
198
-
199
-
200
-
201
-
202
-
203
-
204
-
205
-
206
-
207
-
208
-
209
-
210
-
211
-
212
-
213
-
214
-
215
-
216
 |
 |

161
ANNUAL REPORT 2007 --- adidas Group
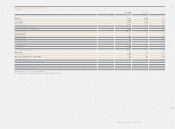
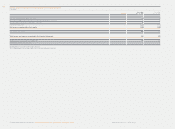
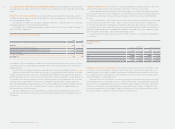
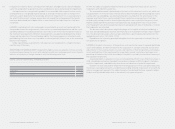
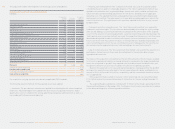
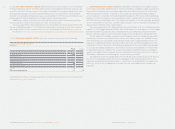
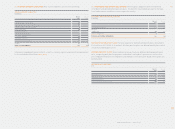
The carrying amounts of acquired goodwill are allocated to the cash-generating units as follows:
ALLOCATION OF GOODWILL
€
in milli
o
n
s
TaylorMade- Total
adidas Reebok adidas Golf goodwill
December 31, 200
6
Additions
Currency effects
December 31, 2007
795 437 284 1,516
6
7
— — — —
(47) (31) (2) (80)
748 406 282 1,436
6
6
In 2007, the adidas Group determined that no impairment of goodwill was necessary.
The recoverable amount of a cash-generating unit is determined on the basis of fair value
less costs to sell, which are calculated with 1 % of the fair value. These calculations use cash
fl ow projections based on the fi nancial planning covering a fi ve-year period in total. Cash fl ows
beyond the fi ve-year period are extrapolated using steady growth rates of 2.0 % to 2.5 % (2006:
2 %). These growth rates do not exceed the long-term average growth rate of the business in
which each cash-generating unit operates.
Discount rates are based on a weighted average cost of capital calculation considering a
fi ve-year average debt / equity structure and fi nancing costs including the Group’s major compe-
titors of each cash-generating unit. The discount rates used are after-tax rates and refl ect the
specifi c equity and country risk of the relevant cash-generating unit. The applied discount rates
for specifi c cash-generating units are between 7.5 % and 8.4 % (2006: between 7.2 % and 8.0 %).
RESEARCH AND DEVELOPMENT Research costs are expensed as incurred. Development costs
are also expensed as incurred when recognition criteria are not met.
The Group spent € 84 million and € 98 million on product research and development for the
years ending December 31, 2007 and 2006, respectively.
FINANCIAL ASSETS All purchases and sales of fi nancial assets are recognized on the trade date.
Costs of purchases include transaction costs. If the fair value of available-for-sale fi nancial
assets (i. e. non-derivative fi nancial assets which are not allocable under another category of IAS
39) can be measured reliably, they are subsequently carried at fair value. Realized and
unrealized gains and losses arising from changes in the fair value of fi nancial assets are
included in the income statement for the period in which they arise except for available-for-sale
fi nancial assets where unrealized gains and losses are recognized in equity unless they are
impaired.
BORROWINGS AND OTHER LIABILITIES Borrowings and other liabilities are recognized at fair
value using the effective interest method, net of transaction costs incurred. In subsequent
periods, long-term borrowings are stated at amortized cost using the “effective interest
method”. Any difference between proceeds (net of transaction costs) and the redemption value
is recognized in the income statement over the term of the borrowing.
The fair value of the liability component of the Group’s convertible bond is determined using
a market interest rate for a comparable straight bond. This amount is presented as part of long-
term borrowings on an amortized cost basis until conversion or maturity of the bond. The
remaining portion is included in shareholders’ equity where the value of the equity component is
not changed in subsequent periods.
ACCRUED LIABILITIES AND PROVISIONS Provisions are recognized where a present obligation
(legal or constructive) to third parties has been incurred which is likely to lead to an outfl ow
of resources where the timing or amount is uncertain. Non-current provisions are discounted
if the effect of discounting is material.
With respect to accrued liabilities, the timing and amount of an outfl ow of resources is not
uncertain.
PENSIONS AND SIMILAR OBLIGATIONS Provisions for pensions and similar obligations com-
prise the Group provision obligation under defi ned benefi t and contribution plans. Obligations
under defi ned benefi t plans are calculated separately for each plan by estimating the benefi t
amount that employees have earned in return for their service during the current and prior
periods. That benefi t is discounted to determine its present value, and the fair value of any plan
assets is deducted. The discount rate is the yield at the balance sheet date on high-quality
corporate bonds. Calculations are performed by qualifi ed actuaries using the projected unit
credit method in accordance with IAS 19. Obligations for contributions to defi ned contribution
plans are recognized as an expense in the income statement when they are due.
As of January 1, 2005, due to application of the amendment to IAS 19 (“Employee Benefi ts”
issued in December 2004), the Group recognizes actuarial gains or losses to defi ned benefi t
plans arising during the fi nancial year immediately outside the income statement in “other
reserves” within equity as shown in the statement of recognized income and expense.
05