Reebok 2007 Annual Report Download - page 89
Download and view the complete annual report
Please find page 89 of the 2007 Reebok annual report below. You can navigate through the pages in the report by either clicking on the pages listed below, or by using the keyword search tool below to find specific information within the annual report.-
 1
1 -
2
-
3
-
4
-
5
-
6
-
7
-
8
-
9
-
10
-
11
-
12
-
13
-
14
-
15
-
16
-
17
-
18
-
19
-
20
-
21
-
22
-
23
-
24
-
25
-
26
-
27
-
28
-
29
-
30
-
31
-
32
-
33
-
34
-
35
-
36
-
37
-
38
-
39
-
40
-
41
-
42
-
43
-
44
-
45
-
46
-
47
-
48
-
49
-
50
-
51
-
52
-
53
-
54
-
55
-
56
-
57
-
58
-
59
-
60
-
61
-
62
-
63
-
64
-
65
-
66
-
67
-
68
-
69
-
70
-
71
-
72
-
73
-
74
-
75
-
76
-
77
-
78
-
 79
79 -
 80
80 -
 81
81 -
 82
82 -
 83
83 -
 84
84 -
 85
85 -
 86
86 -
 87
87 -
 88
88 -
 89
89 -
 90
90 -
 91
91 -
 92
92 -
 93
93 -
 94
94 -
 95
95 -
 96
96 -
 97
97 -
 98
98 -
 99
99 -
100
-
101
-
102
-
103
-
104
-
105
-
106
-
107
-
108
-
109
-
110
-
111
-
112
-
113
-
114
-
115
-
116
-
117
-
118
-
119
-
120
-
121
-
122
-
123
-
124
-
125
-
126
-
127
-
128
-
129
-
130
-
131
-
132
-
133
-
134
-
135
-
136
-
137
-
138
-
139
-
140
-
141
-
142
-
143
-
144
-
145
-
146
-
147
-
148
-
149
-
150
-
151
-
152
-
153
-
154
-
155
-
156
-
157
-
158
-
159
-
160
-
161
-
162
-
163
-
164
-
165
-
166
-
167
-
168
-
169
-
170
-
171
-
172
-
173
-
174
-
175
-
176
-
177
-
178
-
179
-
180
-
181
-
182
-
183
-
184
-
185
-
186
-
187
-
188
-
189
-
190
-
191
-
192
-
193
-
194
-
195
-
196
-
197
-
198
-
199
-
200
-
201
-
202
-
203
-
204
-
205
-
206
-
207
-
208
-
209
-
210
-
211
-
212
-
213
-
214
-
215
-
216
 |
 |
085
ANNUAL REPORT 2007 --- adidas Group
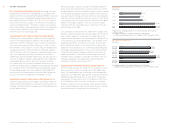
03
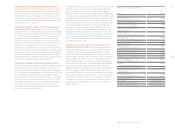
OPERATING OVERHEADS INCREASE AS A PERCENTAGE OF
SALES Group operating overheads include overhead costs
related to marketing, sales, logistics, research and develop-
ment as well as central fi nance and administration functions.
Operating over head expenses as a percentage of sales in-
creased 2.2 percentage points to 26.0 % in 2007 from 23.8 %
in the prior year. This was primarily a result of higher own-
retail expenditures, which increased in line with the expansion
of the Group’s own-retail activities. Central fi nance and ad-
ministration expenses also grew overproportionately due to
integration expenses in the Group’s Headquarter functions.
However, research and development expenditure decreased
as a result of the combination of certain adidas and Reebok
research capabilities. see Research and Development, p. 072
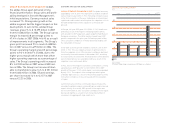
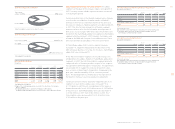
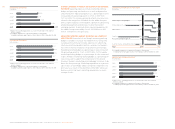
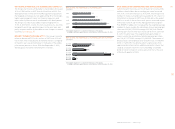
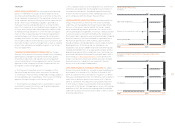
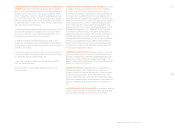
EBITDA UP 8 % The Group’s earnings before interest, taxes,
depreciation and amortization of tangible and intangible
assets (EBITDA) increased 8 % to € 1.165 billion in 2007
(2006: € 1.078 billion). Depreciation and amortization expense
for tangible and intangible assets with limited useful lives
grew 1 % to € 211 million in 2007 (2006: € 209 million). In
accordance with International Financial Reporting Standards,
intangible assets with unlimited useful lives (goodwill and
trademarks) are tested annually and additionally when there
are indications of potential impairment. No impairment of
intangible assets was incurred in 2007 and 2006.
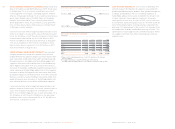
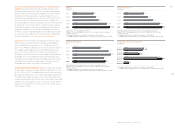
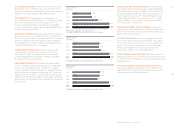
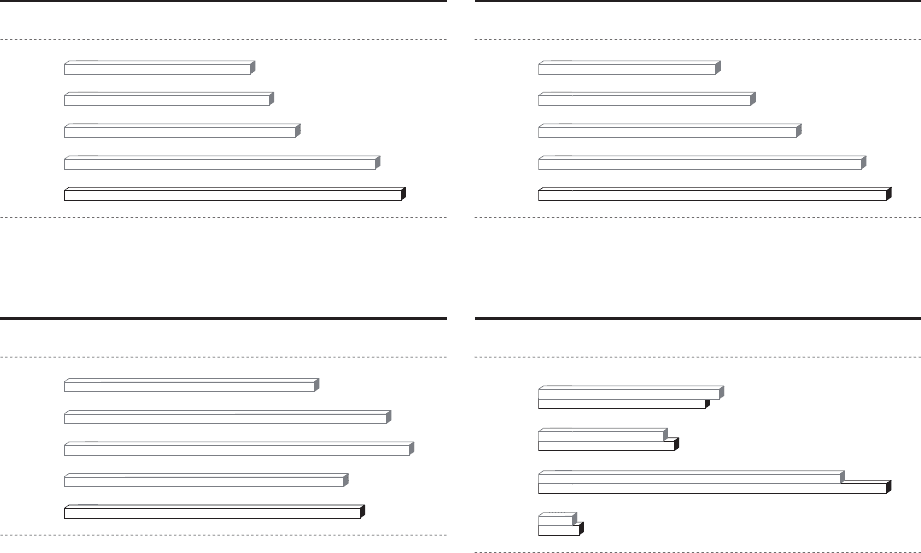
OPERATING MARGIN REACHES 9.2 % The operating margin
of the adidas Group increased 0.5 percentage points to 9.2 %
in 2007 (2006: 8.7 %). This development was in line with initial
Management expectations of an operating margin around 9 %.
The operating margin increase is a result of the Group’s gross
margin improvement, which more than offset higher operating
expenses as a percentage of sales. As a result, Group operat-
ing profi t increased 8 % in 2007 to reach € 949 million versus
€ 881 million in 2006.
EBITDA
€
in million
s
2003
2004 1) 2)
2005 2)
2006 3)
2007
1
) Adjusted to refl ect the application of IAS 32
.
2) Fi
g
ures refl ect continuin
g
operations as a result of the divestiture of the Salomon
b
usiness se
g
ment
.
3
)
Including Reebok business segment from February 1, 2006 onwards.
I
ncluding Greg Norman apparel business from February 1, 2006 to November 30, 2006.
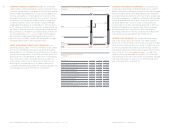
OPERATING MARGIN
in %
OPERATING PROFIT
€
in millions
2003 1)
2004 2)
2005 2)
2006 3)
2007
1)
Excludin
g
royalty and commission income as well as
g
oodwill amortization
.
2
)
Fi
g
ures refl ect continuin
g
operations as a result of the divestiture of the Salomon
b
us
i
ness segment
.
3) Including Reebok business segment from February 1, 2006 onwards.
I
ncludin
g
Gre
g
Norman apparel business from February 1, 2006 to November
3
0, 2006.
2003 1)
2004 2)
2005 2)
2006 3)
200
7
1
) Excluding royalty and commission income as well as goodwill amortization
.
2
) Fi
g
ures refl ect continuin
g
operations as a result of the divestiture of the Salomo
n
business se
g
ment.
3)
Including Reebok business segment from February 1, 2006 onwards.
Including Greg Norman apparel business from February 1, 2006 to November 30, 2006
.
1,078
1
,
165
10.0
584716
10.7
707806
8.7
881
9.
2
949
7.8
490652
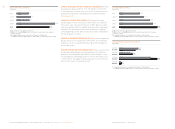
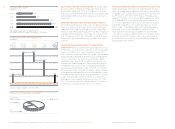
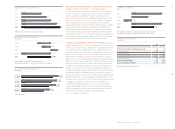
OPERATING PROFIT BY QUARTER 1)
€
in milli
o
n
s
Q1 2006
Q
1 200
7
Q2 2006
Q
2 200
7
Q3 2006
Q3
200
7
Q4 2006
Q
4 200
7
1)
Includin
g
Reebok business se
g
ment from February 1, 2006 onwards.
Including Greg Norman apparel business from February 1, 2006 to November 30, 2006
.
471
409
1
88
173
229
248
61
52