Reebok 2007 Annual Report Download - page 3
Download and view the complete annual report
Please find page 3 of the 2007 Reebok annual report below. You can navigate through the pages in the report by either clicking on the pages listed below, or by using the keyword search tool below to find specific information within the annual report.-
 1
1 -
 2
2 -
 3
3 -
 4
4 -
 5
5 -
 6
6 -
 7
7 -
 8
8 -
 9
9 -
 10
10 -
 11
11 -
 12
12 -
 13
13 -
 14
14 -
 15
15 -
 16
16 -
 17
17 -
 18
18 -
 19
19 -
 20
20 -
 21
21 -
 22
22 -
 23
23 -
 24
24 -
 25
25 -
 26
26 -
 27
27 -
 28
28 -
 29
29 -
 30
30 -
 31
31 -
 32
32 -
 33
33 -
 34
34 -
 35
35 -
 36
36 -
 37
37 -
 38
38 -
 39
39 -
 40
40 -
 41
41 -
 42
42 -
 43
43 -
 44
44 -
 45
45 -
 46
46 -
 47
47 -
 48
48 -
 49
49 -
 50
50 -
 51
51 -
 52
52 -
 53
53 -
 54
54 -
 55
55 -
 56
56 -
 57
57 -
 58
58 -
 59
59 -
 60
60 -
 61
61 -
 62
62 -
 63
63 -
 64
64 -
 65
65 -
 66
66 -
 67
67 -
 68
68 -
 69
69 -
 70
70 -
 71
71 -
 72
72 -
 73
73 -
 74
74 -
 75
75 -
 76
76 -
 77
77 -
 78
78 -
 79
79 -
 80
80 -
 81
81 -
 82
82 -
 83
83 -
 84
84 -
 85
85 -
 86
86 -
 87
87 -
 88
88 -
 89
89 -
 90
90 -
 91
91 -
 92
92 -
 93
93 -
 94
94 -
 95
95 -
 96
96 -
 97
97 -
 98
98 -
 99
99 -
 100
100 -
 101
101 -
 102
102 -
 103
103 -
 104
104 -
 105
105 -
 106
106 -
 107
107 -
 108
108 -
 109
109 -
 110
110 -
 111
111 -
 112
112 -
 113
113 -
 114
114 -
 115
115 -
 116
116 -
 117
117 -
 118
118 -
 119
119 -
 120
120 -
 121
121 -
 122
122 -
 123
123 -
 124
124 -
 125
125 -
 126
126 -
 127
127 -
 128
128 -
 129
129 -
 130
130 -
 131
131 -
 132
132 -
 133
133 -
 134
134 -
 135
135 -
 136
136 -
 137
137 -
 138
138 -
 139
139 -
 140
140 -
 141
141 -
 142
142 -
 143
143 -
 144
144 -
 145
145 -
 146
146 -
 147
147 -
 148
148 -
 149
149 -
 150
150 -
 151
151 -
 152
152 -
 153
153 -
 154
154 -
 155
155 -
 156
156 -
 157
157 -
 158
158 -
 159
159 -
 160
160 -
 161
161 -
 162
162 -
 163
163 -
 164
164 -
 165
165 -
 166
166 -
 167
167 -
 168
168 -
 169
169 -
 170
170 -
 171
171 -
 172
172 -
 173
173 -
 174
174 -
 175
175 -
 176
176 -
 177
177 -
 178
178 -
 179
179 -
 180
180 -
 181
181 -
 182
182 -
 183
183 -
 184
184 -
 185
185 -
 186
186 -
 187
187 -
 188
188 -
 189
189 -
 190
190 -
 191
191 -
 192
192 -
 193
193 -
 194
194 -
 195
195 -
 196
196 -
 197
197 -
 198
198 -
 199
199 -
 200
200 -
 201
201 -
 202
202 -
 203
203 -
 204
204 -
 205
205 -
 206
206 -
 207
207 -
 208
208 -
 209
209 -
 210
210 -
 211
211 -
 212
212 -
 213
213 -
 214
214 -
 215
215 -
 216
216
 |
 |

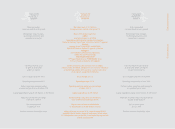
TARGETS AND RESULTS
ADIDAS GROUP KEY FIGURES
200820072007
TARGETS AND RESULTS
ADIDAS GROUP KEY FIGURES
TARGETS RESULTS TARGETS
---
Mid-single-digit
currency-neutral sales growth
---
Bring major new concepts,
technology evolutions and
revolutions to market
---
Currency-neutral sales
to grow at all brands
and in all regions
---
Gross margin range 45 – 47 %
---
Operating margin around 9 %
---
Reduce operating working capital
as a percentage of sales to below 25 %
---
Capital expenditure range € 300 million – € 400 million
---
Reduce year-end net borrowings
to below € 2 billion
---
Net income growth
to approach 15 %
---
Further increase shareholder value
---
Net sales reach € 10.3 billion;
Group currency-neutral sales grow 7 %
---
Major 2007 product launches:
adidas
new technologies in adiSTAR,
SuperNova and Response running shoe families,
Stella McCartney “Gym / Yoga” collection, TechFit™ apparel
Reebok
running shoes Trinity KFS II and HATANA,
Rbk EDGE Uniform System™ apparel collection
Rockport
fi rst footwear collection incorporating
adidas Torsion ® technology
TaylorMade-adidas Golf
r7 ® SuperQuad drivers, POWERBAND shoe,
Clima concept extended to Golf apparel
---
Currency-neutral sales increase 12 % at adidas,
remain stable at Reebok and grow 9 % on a like-for-like basis
at TaylorMade-adidas Golf; currency-neutral sales grow
in all regions except North America
---
Gross margin: 47.4 %
---
Operating margin: 9.2 %
---
Operating working capital as a percentage
of sales: 25.2 %
---
Capital expenditure: € 289 million
---
Net borrowings reduced to € 1.766 billion;
year-end fi nancial leverage: 58.4 %
---
Highest ever net income attributable
to shareholders at € 551 million (+ 14 %)
---
adidas AG share increased 36 %, outperforming DAX-30
and MSCI World Textiles, Apparel and Luxury Goods Index;
19 % dividend increase proposed; share buyback program initi-
ated in January 2008
---
High-single-digit
currency-neutral sales growth
---
Bring major new concepts,
technology evolutions and
revolutions to market
---
Currency-neutral sales to grow
at all brands and in all regions
except North America
---
Gross margin range 47.5 % and 48 %
---
Operating margin to be at least 9.5 %
---
Further reduce operating working capital
as a percentage of sales
---
Capital expenditure range € 300 million – € 400 million
---
Maintain or further reduce net borrowings
despite share buyback
---
Net income to grow
at least 15 %
---
Further increase shareholder value
