Pizza Hut 2015 Annual Report Download - page 89
Download and view the complete annual report
Please find page 89 of the 2015 Pizza Hut annual report below. You can navigate through the pages in the report by either clicking on the pages listed below, or by using the keyword search tool below to find specific information within the annual report.-
 1
1 -
2
-
3
-
4
-
5
-
6
-
7
-
8
-
9
-
10
-
11
-
12
-
13
-
14
-
15
-
16
-
17
-
18
-
19
-
20
-
21
-
22
-
23
-
24
-
25
-
26
-
27
-
28
-
29
-
30
-
31
-
32
-
33
-
34
-
35
-
36
-
37
-
38
-
39
-
40
-
41
-
42
-
43
-
44
-
45
-
46
-
47
-
48
-
49
-
50
-
51
-
52
-
53
-
54
-
55
-
56
-
57
-
58
-
59
-
60
-
61
-
62
-
63
-
64
-
65
-
66
-
67
-
68
-
69
-
70
-
71
-
72
-
73
-
74
-
75
-
76
-
77
-
78
-
 79
79 -
 80
80 -
 81
81 -
 82
82 -
 83
83 -
 84
84 -
 85
85 -
 86
86 -
 87
87 -
 88
88 -
 89
89 -
 90
90 -
 91
91 -
 92
92 -
 93
93 -
 94
94 -
 95
95 -
 96
96 -
 97
97 -
 98
98 -
 99
99 -
100
-
101
-
102
-
103
-
104
-
105
-
106
-
107
-
108
-
109
-
110
-
111
-
112
-
113
-
114
-
115
-
116
-
117
-
118
-
119
-
120
-
121
-
122
-
123
-
124
-
125
-
126
-
127
-
128
-
129
-
130
-
131
-
132
-
133
-
134
-
135
-
136
-
137
-
138
-
139
-
140
-
141
-
142
-
143
-
144
-
145
-
146
-
147
-
148
-
149
-
150
-
151
-
152
-
153
-
154
-
155
-
156
-
157
-
158
-
159
-
160
-
161
-
162
-
163
-
164
-
165
-
166
-
167
-
168
-
169
-
170
-
171
-
172
-
173
-
174
-
175
-
176
-
177
-
178
-
179
-
180
-
181
-
182
-
183
-
184
-
185
-
186
 |
 |
YUM! BRANDS, INC.-2016Proxy Statement 75
Proxy Statement
DIRECTOR COMPENSATION
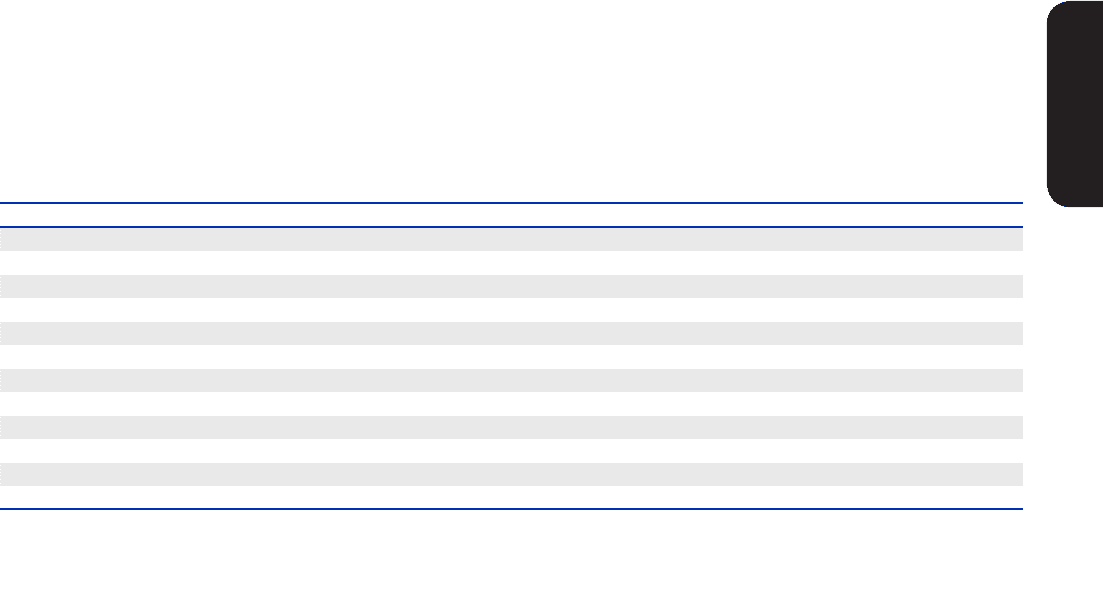
The table below summarizes compensation paid to each non-employee director during 2015.
The Company primarily uses stock-based incentive
compensation to attract and retain qualified candidates to
serve on the Board. In setting director compensation, the
Company considers the significant amount of time that
directors expend in fulfilling their duties to the Company as
well as the skill level required by the Company of members
of the Board. The Board typically reviews each element of
director compensation every two years.
In 2015, the Management Planning and Development
Committee of the Board (“Committee”) benchmarked the
Company’s director compensation against director
compensation from the Company’s Executive Peer Group
discussed at page 36 as well as published survey data from
the National Association of Corporate Directors for the
largest 200 companies in the S&P 500. Data for this review
was prepared for the Committee by its independent
consultant, Meridian Compensation Partners LLC. This
data revealed that the Company’s director compensation
was below the 50th percentile against both benchmarks
and that the retainers paid to the Lead Director and the
Chairpersons of the Audit Committee and the Management
Planning and Development Committee were consistent
with market practice. Following its review, the Board elected
to increase non-employee director annual compensation
to $240,000 which was approximately at the 50
th
percentile
of the Company’s Executive Peer Group (directors will
receive a stock grant retainer with a fair market value of
$200,000 and an annual SARs grant with an economic
value of approximately $40,000). This change became
effective in February 2016 and was paid beginning in February
2016. Previously, directors were paid in November of each
year. This change in timing to February 2016 means that
directors did not receive a stock retainer award or a SARs
award during 2015, and, therefore, no stock retainer award
or SARs award is reported below, except in the case of
Messrs. Cornell and Meister who received initial stock
retainer awards of $25,000 upon joining the Board in 2015.
In addition, Mr.Cornell received a prorated stock retainer
and SARs award for joining the Board two months prior to
the Board adopting the changes described above.
The Board elected not to change retainers paid to the
Chairpersons or Lead Director.
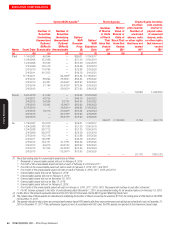
Name
Fees Earned or
Paid in Cash
($)
Stock
Awards
($)(1)
Option/SAR
Awards
($)(2)(3)
All Other
Compensation
($)(4)
Total
($)
(a) (b) (c) (d) (e) (f)
Cavanagh, Michael — — — 15,172 15,172
Cornell, Brian — 39,167 2,807 — 41,973
Dorman, Dave — — — 10,000 10,000
Ferragamo, Massimo — — — — —
Graddick-Weir, Mirian — — — 7,500 7,500
Hill, Bonnie — — — — —
Linen, Jonathan — — — 10,000 10,000
Meister, Keith — 25,000 — 25,000 50,000
Nelson, Thomas — — — 1,000 1,000
Ryan, Thomas — — — 2,500 2,500
Stock, Elane — — — 1,000 1,000
Walter, Robert — — — 5,000 5,000
(1) Amounts in column (c) represent the grant date fair value for annual stock retainer awards granted to directors in 2015.
(2) Amounts in column (d) represent the grant date fair value for annual SARs granted in fiscal 2015. For a discussion of the assumptions used to value the
awards, see the discussion of stock awards and option awards contained in Part II, Item 8, “Financial Statements and Supplementary Data” of the 2015
Annual Report in Notes to Consolidated Financial Statements at Note 14, “Share-based and Deferred Compensation Plans.”