Pizza Hut 2015 Annual Report Download - page 79
Download and view the complete annual report
Please find page 79 of the 2015 Pizza Hut annual report below. You can navigate through the pages in the report by either clicking on the pages listed below, or by using the keyword search tool below to find specific information within the annual report.-
 1
1 -
2
-
3
-
4
-
5
-
6
-
7
-
8
-
9
-
10
-
11
-
12
-
13
-
14
-
15
-
16
-
17
-
18
-
19
-
20
-
21
-
22
-
23
-
24
-
25
-
26
-
27
-
28
-
29
-
30
-
31
-
32
-
33
-
34
-
35
-
36
-
37
-
38
-
39
-
40
-
41
-
42
-
43
-
44
-
45
-
46
-
47
-
48
-
49
-
50
-
51
-
52
-
53
-
54
-
55
-
56
-
57
-
58
-
59
-
60
-
61
-
62
-
63
-
64
-
65
-
66
-
67
-
68
-
 69
69 -
 70
70 -
 71
71 -
 72
72 -
 73
73 -
 74
74 -
 75
75 -
 76
76 -
 77
77 -
 78
78 -
 79
79 -
 80
80 -
 81
81 -
 82
82 -
 83
83 -
 84
84 -
 85
85 -
 86
86 -
 87
87 -
 88
88 -
 89
89 -
90
-
91
-
92
-
93
-
94
-
95
-
96
-
97
-
98
-
99
-
100
-
101
-
102
-
103
-
104
-
105
-
106
-
107
-
108
-
109
-
110
-
111
-
112
-
113
-
114
-
115
-
116
-
117
-
118
-
119
-
120
-
121
-
122
-
123
-
124
-
125
-
126
-
127
-
128
-
129
-
130
-
131
-
132
-
133
-
134
-
135
-
136
-
137
-
138
-
139
-
140
-
141
-
142
-
143
-
144
-
145
-
146
-
147
-
148
-
149
-
150
-
151
-
152
-
153
-
154
-
155
-
156
-
157
-
158
-
159
-
160
-
161
-
162
-
163
-
164
-
165
-
166
-
167
-
168
-
169
-
170
-
171
-
172
-
173
-
174
-
175
-
176
-
177
-
178
-
179
-
180
-
181
-
182
-
183
-
184
-
185
-
186
 |
 |

YUM! BRANDS, INC.-2016Proxy Statement 65
Proxy Statement
EXECUTIVE COMPENSATION
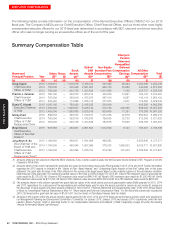
(5) Amounts in this column reflect the full grant date fair value of the PSU awards shown in column (g) and the SARs/stock options shown in column (i). The
grant date fair value is the amount that the Company is expensing in its financial statements over the award’s vesting schedule. For PSUs, fair value is
calculated by multiplying the per unit value of the award ($73.93) by the target number of units corresponding to the most probable outcome of performance
conditions on the grant date. For SARs/stock options, fair value of $15.94 was calculated using the Black-Scholes value on the February 6, 2015 grant date.
For additional information regarding valuation assumptions of SARs/stock options, see the discussion of stock awards and option awards contained in Part II,
Item 8, “Financial Statements and Supplementary Data” of the 2015 Annual Report in Notes to Consolidated Financial Statements at Note 14, “Share-based
and Deferred Compensation Plans.”
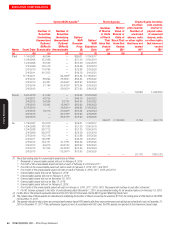
Outstanding Equity Awards at Year-End
The following table shows the number of shares covered by exercisable and unexercisable stock options, SARs, and
unvested RSUs and PSUs held by the Company’s NEOs on December31, 2015.
Name Grant Date
Option/SAR Awards(1) Stock Awards Equity
incentive
plan awards:
Number of
unearned
shares, units
or other rights
that have not
vested
(#)(4)
Equity incentive
plan awards:
market or
payout value
of unearned
shares, units
or other rights
that have not
vested
($)(3)
Number of
Securities
Underlying
Unexercised
Options/
SARs (#)
Exercisable
Number of
Securities
Underlying
Unexercised
Options/
SARs (#)
Unexercisable
Option/
SAR
Exercise
Price
($)
Option/
SAR
Expiration
Date
Number
of Shares
or Units
of Stock
That
Have Not
Vested
(#)(2)
Market
Value of
Shares or
Units of
Stock That
Have Not
Vested
($)(3)
(a) (b)
(c) (d)
(e) (f) (g) (h) (i)
Creed 1/24/2008 107,085 — $37.30 1/24/2018
2/5/2009 169,148 — $29.29 2/5/2019
2/5/2010 172,118 — $32.98 2/5/2020
2/4/2011 122,200 — $49.30 2/4/2021
2/8/2012 62,066 20,689(i) $64.44 2/8/2022
2/6/2013 45,461 45,462(ii) $62.93 2/6/2023
2/5/2014 19,512 58,538(iii) $70.54 2/5/2024
2/5/2014 — 68,767(vi) $70.54 2/5/2024
2/6/2015 — 194,982(iv) $73.93 2/6/2025
— — 38,298 2,797,669
Grismer 1/19/2007 19,938 — $29.61 1/19/2017
5/17/2007 16,262 — $33.20 5/17/2017
1/24/2008 20,079 — $37.30 1/24/2018
2/5/2009 33,830 — $29.29 2/5/2019
5/21/2009 15,853 — $33.21 5/21/2019
2/5/2010 34,424 — $32.98 2/5/2020
2/5/2010 43,030 — $32.98 2/5/2020
2/4/2011 24,440 — $49.30 2/4/2021
2/8/2012 24,826 8,276(i) $64.44 2/8/2022
2/6/2013 37,885 37,885(ii)(xi) $62.93 2/6/2023
2/6/2013 — 45,462(v)(xi) $62.93 2/6/2023
2/5/2014 21,145 63,438(iii)(xi) $70.54 2/5/2024
2/6/2015 — 105,396(iv)(xi) $73.93 2/6/2025
— — 21,288 1,555,088
Novak 1/19/2007 490,960 — $29.61 1/19/2017
1/24/2008 428,339 — $37.30 1/24/2018
2/5/2009 575,102 — $29.29 2/5/2019
2/5/2010 623,925 — $32.98 2/5/2020
2/4/2011 496,254 — $49.30 2/4/2021
2/8/2012 282,996 94,332(i) $64.44 2/8/2022
2/6/2013 180,478 180,478(ii) $62.93 2/6/2023
2/5/2014 74,901 224,706(iii) $70.54 2/5/2024
2/6/2015 — 136,034(x) $73.93 2/6/2025
— — 74,870 5,469,254