Pizza Hut 2015 Annual Report Download - page 72
Download and view the complete annual report
Please find page 72 of the 2015 Pizza Hut annual report below. You can navigate through the pages in the report by either clicking on the pages listed below, or by using the keyword search tool below to find specific information within the annual report.-
 1
1 -
2
-
3
-
4
-
5
-
6
-
7
-
8
-
9
-
10
-
11
-
12
-
13
-
14
-
15
-
16
-
17
-
18
-
19
-
20
-
21
-
22
-
23
-
24
-
25
-
26
-
27
-
28
-
29
-
30
-
31
-
32
-
33
-
34
-
35
-
36
-
37
-
38
-
39
-
40
-
41
-
42
-
43
-
44
-
45
-
46
-
47
-
48
-
49
-
50
-
51
-
52
-
53
-
54
-
55
-
56
-
57
-
58
-
59
-
60
-
61
-
 62
62 -
 63
63 -
 64
64 -
 65
65 -
 66
66 -
 67
67 -
 68
68 -
 69
69 -
 70
70 -
 71
71 -
 72
72 -
 73
73 -
 74
74 -
 75
75 -
 76
76 -
 77
77 -
 78
78 -
 79
79 -
 80
80 -
 81
81 -
 82
82 -
83
-
84
-
85
-
86
-
87
-
88
-
89
-
90
-
91
-
92
-
93
-
94
-
95
-
96
-
97
-
98
-
99
-
100
-
101
-
102
-
103
-
104
-
105
-
106
-
107
-
108
-
109
-
110
-
111
-
112
-
113
-
114
-
115
-
116
-
117
-
118
-
119
-
120
-
121
-
122
-
123
-
124
-
125
-
126
-
127
-
128
-
129
-
130
-
131
-
132
-
133
-
134
-
135
-
136
-
137
-
138
-
139
-
140
-
141
-
142
-
143
-
144
-
145
-
146
-
147
-
148
-
149
-
150
-
151
-
152
-
153
-
154
-
155
-
156
-
157
-
158
-
159
-
160
-
161
-
162
-
163
-
164
-
165
-
166
-
167
-
168
-
169
-
170
-
171
-
172
-
173
-
174
-
175
-
176
-
177
-
178
-
179
-
180
-
181
-
182
-
183
-
184
-
185
-
186
 |
 |

YUM! BRANDS, INC.-2016Proxy Statement58
Proxy Statement
EXECUTIVE COMPENSATION
AutoZone Inc. Kellogg Company Nike Inc.
Avon Products Inc. Kimberly-Clark Corporation Office Depot, Inc.
Campbell Soup Company Kohl’s Corporation Staples Inc.
Colgate Palmolive Company Kraft Foods Group, Inc. Starbucks Corporation
Gap Inc. Macy’s Inc. Starwood Hotels & Resorts Worldwide, Inc.
General Mills Inc. Marriott International Unilever USA
Hilton Worldwide Holdings Inc. McDonald’s Corporation
At the time the benchmarking analysis was prepared, the
Executive Peer Group’s median annual revenues were
$17.6billion, while YUM annual revenues were estimated
at $19.2billion (calculated as described below).
For companies with significant franchise operations, measuring
size can be complex. There are added complexities and
responsibilities for managing the relationships, arrangements,
and overall scope of the franchising enterprise, in particular,
managing product introductions, marketing, promoting new
unit development, and customer satisfaction and overall
operations improvements across the entire franchise system.
Accordingly, in calibrating size-adjusted values, our philosophy
is to add 25% of franchisee and licensee sales to the Company’s
sales to establish an appropriate revenue benchmark. The
reason for this approach is based on our belief that the correct
calibration of complexity and responsibility lies between
corporate-reported revenues and system-wide sales.
Competitive Positioning and Setting Compensation
At the beginning of 2015, the Committee considered Executive
Peer Group compensation data as a frame of reference for
establishing compensation targets for base salary, annual
bonus and long-term incentives for each NEO. In particular,
the Committee generally targeted each NEO’s base salary
and long-term incentive compensation at the 50th percentile
of the Executive Peer Group and target bonus opportunity at
the 75th percentile of the Executive Peer Group. During 2015,
The Committee changed this approach as described at 56.
In setting NEO compensation, the Committee considers
this competitive market data but does not rely on it exclusively.
It also considers additional factors in setting each element
of NEO compensation, including individual performance,
experience, time in role and expected contributions.
When benchmarking and making decisions about the CEO’s
SARs/Options, we use a grant date fair value based on the
full 10-year term rather than the expected term of all SARs/
Options granted by the Company. This methodology is a
more appropriate method to determine the award amount
as it better reflects the actual historical holding pattern for
SARs/Options granted to our CEO. Our CEO receives fewer
shares under this practice than if we used the expected
term of all SARs/Options granted by the Company.
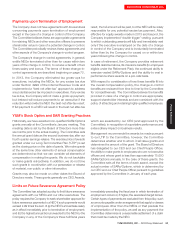
VII. Compensation Policies and Practices
YUM’s Executive Stock Ownership Guidelines
The Committee has established stock ownership guidelines for approximately 400 of our senior employees, including the NEOs.
If a NEO or other executive does not meet his or her ownership guidelines, he or she is not eligible for a long-term equity
incentive award. In 2015, all NEOs and all other employees subject to guidelines met or exceeded their ownership guidelines.
NEO Ownership Guidelines Shares Owned(1) Valueof Shares(2) Multiple ofSalary
Creed 100,000 118,263 8,639,112 8
Grismer 30,000 45,294 3,308,727 4
Novak 100,000 2,760,186 201,631,587 202
Pant 30,000 107,592 7,859,596 8
Niccol 30,000 49,796 3,637,598 5
Su 30,000 575,032 42,006,088 38
(1) Calculated as of December 31, 2015 and represents shares owned outright, vested RSUs and all RSUs awarded under the Company’s Executive Income Deferral Program.
(2) Based on YUM closing stock price of $73.05 as of December 31, 2015.