Pizza Hut 2015 Annual Report Download - page 76
Download and view the complete annual report
Please find page 76 of the 2015 Pizza Hut annual report below. You can navigate through the pages in the report by either clicking on the pages listed below, or by using the keyword search tool below to find specific information within the annual report.-
 1
1 -
2
-
3
-
4
-
5
-
6
-
7
-
8
-
9
-
10
-
11
-
12
-
13
-
14
-
15
-
16
-
17
-
18
-
19
-
20
-
21
-
22
-
23
-
24
-
25
-
26
-
27
-
28
-
29
-
30
-
31
-
32
-
33
-
34
-
35
-
36
-
37
-
38
-
39
-
40
-
41
-
42
-
43
-
44
-
45
-
46
-
47
-
48
-
49
-
50
-
51
-
52
-
53
-
54
-
55
-
56
-
57
-
58
-
59
-
60
-
61
-
62
-
63
-
64
-
65
-
 66
66 -
 67
67 -
 68
68 -
 69
69 -
 70
70 -
 71
71 -
 72
72 -
 73
73 -
 74
74 -
 75
75 -
 76
76 -
 77
77 -
 78
78 -
 79
79 -
 80
80 -
 81
81 -
 82
82 -
 83
83 -
 84
84 -
 85
85 -
 86
86 -
87
-
88
-
89
-
90
-
91
-
92
-
93
-
94
-
95
-
96
-
97
-
98
-
99
-
100
-
101
-
102
-
103
-
104
-
105
-
106
-
107
-
108
-
109
-
110
-
111
-
112
-
113
-
114
-
115
-
116
-
117
-
118
-
119
-
120
-
121
-
122
-
123
-
124
-
125
-
126
-
127
-
128
-
129
-
130
-
131
-
132
-
133
-
134
-
135
-
136
-
137
-
138
-
139
-
140
-
141
-
142
-
143
-
144
-
145
-
146
-
147
-
148
-
149
-
150
-
151
-
152
-
153
-
154
-
155
-
156
-
157
-
158
-
159
-
160
-
161
-
162
-
163
-
164
-
165
-
166
-
167
-
168
-
169
-
170
-
171
-
172
-
173
-
174
-
175
-
176
-
177
-
178
-
179
-
180
-
181
-
182
-
183
-
184
-
185
-
186
 |
 |

YUM! BRANDS, INC.-2016Proxy Statement62
Proxy Statement
EXECUTIVE COMPENSATION
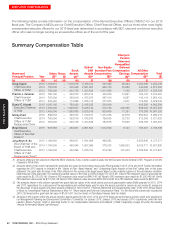
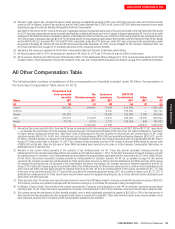
The following tables provide information on the compensation of the Named Executive Officers (“NEOs”) for our 2015
fiscal year. The Company’s NEOs are our Chief Executive Officer, Chief Financial Officer, and our three other most highly
compensated executive officers for our 2015 fiscal year determined in accordance with SEC rules and one former executive
officer who was no longer serving as an executive officer as of the end of the year.
Summary Compensation Table
Name and
PrincipalPosition Year
Salary
($)(1)
Bonus
($)
Stock
Awards
($)(2)
Option/
SAR
Awards
($)(3)
Non-Equity
Incentive Plan
Compensation
($)(4)
Change in
Pension
Value and
Nonqualified
Deferred
Compensation
Earnings
($)(5)
All Other
Compensation
($)(6)
Total
($)
(a) (b) (c) (d) (e) (f) (g) (h) (i)
Greg Creed
Chief Executive
Officer of YUM
2015 1,104,615 — 1,075,016 3,108,013 787,050 25,294 1,393,388 7,493,376
2014 750,000 — 325,048 2,561,957 945,750 45,680 345,068 4,973,503
2013 750,000 — 203,735 1,323,839 1,511,625 7,348 238,737 4,035,284
Patrick J. Grismer
Chief Financial
Officer of YUM
2015 790,192 — 420,070 1,680,012 445,200 12,861 162,132 3,510,467
2014 707,500 — 350,019 1,475,973 267,410 9,087 142,114 2,952,103
2013 638,462 — 114,098 1,765,138 277,875 3,977 179,480 2,979,030
David C. Novak
Executive Chairman
of YUM
2015 1,005,192 — 750,020 2,168,382 530,000 — 409,290 4,862,884
2014 1,450,000 — 1,925,037 5,228,142 512,720 202,360 689,028 10,007,287
2013 1,450,000 — 1,568,655 5,255,519 939,600 17,351 776,268 10,007,393
Micky Pant
Chief Executive
Officer of YUM
Restaurants China
2015 849,038 — 355,012 1,419,011 1,473,548 42,979 950,622 5,090,210
2014 750,000 — 350,019 1,475,973 799,500 32,735 313,356 3,721,583
2013 750,000 — 203,735 1,323,839 784,875 15,640 309,198 3,387,287
Brian Niccol
Chief Executive
Officer of Taco Bell
Division(7)
2015 697,688 — 250,031 2,091,503 1,512,000 8,123 180,361 4,739,706
Jing-Shyh S. Su
Vice Chairman of the
Board of YUM and
Chief Executive
Officer of YUM
Restaurants China(8)
2015 1,100,000 — 459,031 1,834,009 468,683 — 5,455,648 9,317,371
2014 1,100,000 — 450,045 1,907,966 378,235 1,956,023 5,035,711 10,827,980
2013 1,100,000 — 342,294 1,765,123 614,790 727,430 5,768,264 10,317,901
(1) Amounts shown are not reduced to reflect the NEOs’ elections, if any, to defer receipt of salary into the Executive Income Deferral (“EID”) Program or into the
Company’s 401(k) Plan.
(2) Amounts shown in this column represent the grant date fair values for performance share units (PSUs) granted in 2015, 2014 and 2013. Further information
regarding the 2015 awards is included in the “Grants of Plan- Based Awards” and “Outstanding Equity Awards at Year-End” tables later in this proxy
statement. The grant date fair value of the PSUs reflected in this column is the target payout based on the probable outcome of the performance condition,
determined as of the grant date. The maximum potential values of the PSUs is 200% of target. For 2015, Mr.Creed’s PSU maximum value at grant date fair
value would be $2,150,032; Mr.Grismer’s PSU maximum value would be $840,140; Mr.Novak’s PSU maximum value would be $1,500,040; Mr.Pant’s
PSU maximum value would be $710,024; Mr.Niccol’s PSU maximum value would be $500,062 and Mr.Su’s PSU maximum value would be $918,062.
(3) The amounts shown in this column represent the grant date fair values of the stock options and stock appreciation rights (SARs) awarded in 2015, 2014
and 2013, respectively. For a discussion of the assumptions and methodologies used to value the awards reported in column (e) and column (f), please see
the discussion of stock awards and option awards contained in Part II, Item 8, “Financial Statements and Supplementary Data” of the 2015 Annual Report
in Notes to Consolidated Financial Statements at Note 14, “Share-based and Deferred Compensation Plans.” For Mr.Niccol this column also includes his
2015 CEO Award with a grant date fair value of $1,091,491. See the Grants of Plan-Based Awards table for details.
(4) Amounts in this column reflect the annual incentive awards earned for the 2015, 2014 and 2013 fiscal year performance periods, which were awarded by
our Management Planning and Development Committee (“Committee”) in January 2016, January 2015 and January 2014, respectively, under the Yum
Leaders’ Bonus Program, which is described further in our Compensation Discussion and Analysis (“CD&A”) beginning at page 39 under the heading
“Annual Performance-Based Cash Bonuses”.