Pizza Hut 2015 Annual Report Download - page 146
Download and view the complete annual report
Please find page 146 of the 2015 Pizza Hut annual report below. You can navigate through the pages in the report by either clicking on the pages listed below, or by using the keyword search tool below to find specific information within the annual report.-
 1
1 -
2
-
3
-
4
-
5
-
6
-
7
-
8
-
9
-
10
-
11
-
12
-
13
-
14
-
15
-
16
-
17
-
18
-
19
-
20
-
21
-
22
-
23
-
24
-
25
-
26
-
27
-
28
-
29
-
30
-
31
-
32
-
33
-
34
-
35
-
36
-
37
-
38
-
39
-
40
-
41
-
42
-
43
-
44
-
45
-
46
-
47
-
48
-
49
-
50
-
51
-
52
-
53
-
54
-
55
-
56
-
57
-
58
-
59
-
60
-
61
-
62
-
63
-
64
-
65
-
66
-
67
-
68
-
69
-
70
-
71
-
72
-
73
-
74
-
75
-
76
-
77
-
78
-
79
-
80
-
81
-
82
-
83
-
84
-
85
-
86
-
87
-
88
-
89
-
90
-
91
-
92
-
93
-
94
-
95
-
96
-
97
-
98
-
99
-
100
-
101
-
102
-
103
-
104
-
105
-
106
-
107
-
108
-
109
-
110
-
111
-
112
-
113
-
114
-
115
-
116
-
117
-
118
-
119
-
120
-
121
-
122
-
123
-
124
-
125
-
126
-
127
-
128
-
129
-
130
-
131
-
132
-
133
-
134
-
135
-
 136
136 -
 137
137 -
 138
138 -
 139
139 -
 140
140 -
 141
141 -
 142
142 -
 143
143 -
 144
144 -
 145
145 -
 146
146 -
 147
147 -
 148
148 -
 149
149 -
 150
150 -
 151
151 -
 152
152 -
 153
153 -
 154
154 -
 155
155 -
 156
156 -
157
-
158
-
159
-
160
-
161
-
162
-
163
-
164
-
165
-
166
-
167
-
168
-
169
-
170
-
171
-
172
-
173
-
174
-
175
-
176
-
177
-
178
-
179
-
180
-
181
-
182
-
183
-
184
-
185
-
186
 |
 |

YUM! BRANDS, INC.-2015 Form10-K38
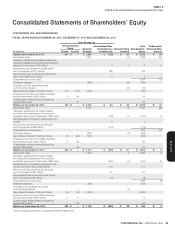
Form 10-K
PART II
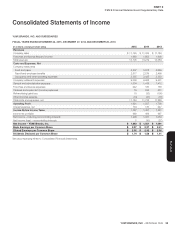
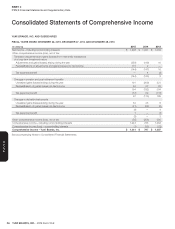
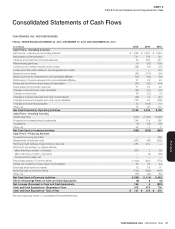
ITEM 8Financial Statements and Supplementary Data
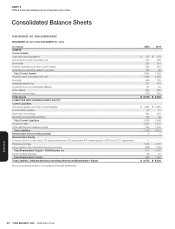
Consolidated Balance Sheets
YUM! BRANDS, INC. AND SUBSIDIARIES
DECEMBER 26, 2015 AND DECEMBER 27, 2014
(in millions)
2015 2014
ASSETS
Current Assets
Cash and cash equivalents $ 737 $ 578
Accounts and notes receivable, net 377 325
Inventories 229 301
Prepaid expenses and other current assets 242 254
Advertising cooperative assets, restricted 103 95
Total Current Assets 1,688 1,553
Property, plant and equipment, net 4,189 4,498
Goodwill 656 700
Intangible assets, net 271 318
Investments in unconsolidated affiliates 61 52
Other assets 534 560
Deferred income taxes 676 653
Total Assets $ 8,075 $ 8,334
LIABILITIES AND SHAREHOLDERS’ EQUITY
Current Liabilities
Accounts payable and other current liabilities $ 1,985 $ 1,970
Income taxes payable 77 77
Short-term borrowings 923 267
Advertising cooperative liabilities 103 95
Total Current Liabilities 3,088 2,409
Long-term debt 3,054 3,077
Other liabilities and deferred credits 958 1,235
Total Liabilities 7,100 6,721
Redeemable noncontrolling interest 6 9
Shareholders’ Equity
Common Stock, no par value, 750 shares authorized; 420 shares and 434 shares issued in 2015 and 2014, respectively — —
Retained earnings 1,150 1,737
Accumulated other comprehensive income (loss) (239) (190)
Total Shareholders’ Equity – YUM! Brands, Inc. 911 1,547
Noncontrolling interests 58 57
Total Shareholders’ Equity 969 1,604
Total Liabilities, Redeemable Noncontrolling Interest and Shareholders’ Equity $ 8,075 $ 8,334
See accompanying Notes to Consolidated Financial Statements.