Pizza Hut 2015 Annual Report Download - page 130
Download and view the complete annual report
Please find page 130 of the 2015 Pizza Hut annual report below. You can navigate through the pages in the report by either clicking on the pages listed below, or by using the keyword search tool below to find specific information within the annual report.-
 1
1 -
2
-
3
-
4
-
5
-
6
-
7
-
8
-
9
-
10
-
11
-
12
-
13
-
14
-
15
-
16
-
17
-
18
-
19
-
20
-
21
-
22
-
23
-
24
-
25
-
26
-
27
-
28
-
29
-
30
-
31
-
32
-
33
-
34
-
35
-
36
-
37
-
38
-
39
-
40
-
41
-
42
-
43
-
44
-
45
-
46
-
47
-
48
-
49
-
50
-
51
-
52
-
53
-
54
-
55
-
56
-
57
-
58
-
59
-
60
-
61
-
62
-
63
-
64
-
65
-
66
-
67
-
68
-
69
-
70
-
71
-
72
-
73
-
74
-
75
-
76
-
77
-
78
-
79
-
80
-
81
-
82
-
83
-
84
-
85
-
86
-
87
-
88
-
89
-
90
-
91
-
92
-
93
-
94
-
95
-
96
-
97
-
98
-
99
-
100
-
101
-
102
-
103
-
104
-
105
-
106
-
107
-
108
-
109
-
110
-
111
-
112
-
113
-
114
-
115
-
116
-
117
-
118
-
119
-
 120
120 -
 121
121 -
 122
122 -
 123
123 -
 124
124 -
 125
125 -
 126
126 -
 127
127 -
 128
128 -
 129
129 -
 130
130 -
 131
131 -
 132
132 -
 133
133 -
 134
134 -
 135
135 -
 136
136 -
 137
137 -
 138
138 -
 139
139 -
 140
140 -
141
-
142
-
143
-
144
-
145
-
146
-
147
-
148
-
149
-
150
-
151
-
152
-
153
-
154
-
155
-
156
-
157
-
158
-
159
-
160
-
161
-
162
-
163
-
164
-
165
-
166
-
167
-
168
-
169
-
170
-
171
-
172
-
173
-
174
-
175
-
176
-
177
-
178
-
179
-
180
-
181
-
182
-
183
-
184
-
185
-
186
 |
 |

YUM! BRANDS, INC.-2015 Form10-K22
Form 10-K
PART II
ITEM7Management’s Discussion and Analysis of Financial Condition and Results of Operations
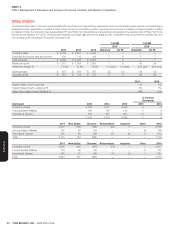
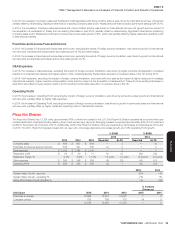
KFC Division
The KFC Division has 14,577 units, approximately 70% of which are located outside the U.S. The KFC Division has experienced significant unit growth
in emerging markets, which comprised approximately 40% of both the Division’s units and profits, respectively, as of the end of 2015. Additionally, 90%
of the KFC Division units were operated by franchisees and licensees as of the end of 2015. For 2015, KFC Division targeted at least 425 net new
international units, low-single-digit same-store sales growth and Operating Profit growth of 10%.
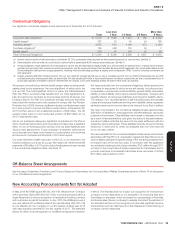
% B/(W) % B/(W)
2015 2014
2015 2014 2013 Reported Ex FX Reported Ex FX
Company sales $ 2,106 $ 2,320 $ 2,192 (9) 5 6 9
Franchise and license fees and income 842 873 844 (4) 7 4 7
Total revenues $ 2,948 $ 3,193 $ 3,036 (8) 6 5 8
Restaurant profit $ 312 $ 308 $ 277 1 16 12 14
Restaurant margin % 14.8% 13.3% 12.6% 1.5 ppts. 1.4 ppts. 0.7 ppts. 0.7 ppts.
G&A expenses $ 386 $ 383 $ 391 (1) (12) 2 —
Operating Profit $ 677 $ 708 $ 649 (4) 8 9 13
2015 2014
System Sales Growth, reported (4)% 2%
System Sales Growth, excluding FX 7% 6%
Same-Store Sales Growth % 3% 3%
% Increase
(Decrease)
Unit Count 2015 2014 2013 2015 2014
Franchise & License 13,189 12,874 12,647 2 2
Company-owned 1,388 1,323 1,257 5 5
14,577 14,197 13,904 3 2
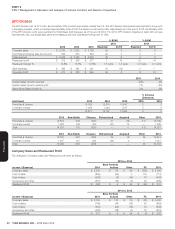
2014 New Builds Closures Refranchised Acquired Other 2015
Franchise & License 12,874 609 (302) 31 (12) (11) 13,189
Company-owned 1,323 106 (22) (31) 12 — 1,388
Total 14,197 715 (324) — — (11) 14,577
2013 New Builds Closures Refranchised Acquired Other 2014
Franchise & License 12,647 553 (356) 39 (4) (5) 12,874
Company-owned 1,257 123 (22) (39) 4 — 1,323
Total 13,904 676 (378) — — (5) 14,197
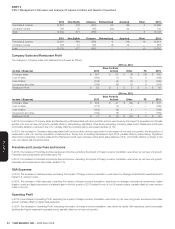
Company Sales and Restaurant Profit
The changes in Company sales and Restaurant profit were as follows:
Income / (Expense)
2015 vs. 2014
2014
Store Portfolio
Actions Other FX 2015
Company sales $ 2,320 $ 54 $ 65 $ (333) $ 2,106
Cost of sales (809) (25) 2 115 (717)
Cost of labor (552) (8) (16) 79 (497)
Occupancy and other (651) (16) (6) 93 (580)
Restaurant Profit $ 308 $ 5 $ 45 $ (46) $ 312
Income / (Expense)
2014 vs. 2013
2013
Store Portfolio
Actions Other FX 2014
Company sales $ 2,192 $ 110 $ 79 $ (61) $ 2,320
Cost of sales (766) (43) (26) 26 (809)
Cost of labor (521) (25) (16) 10 (552)
Occupancy and other (628) (38) (3) 18 (651)
Restaurant Profit $ 277 $ 4 $ 34 $ (7) $ 308