Pizza Hut 2015 Annual Report Download - page 147
Download and view the complete annual report
Please find page 147 of the 2015 Pizza Hut annual report below. You can navigate through the pages in the report by either clicking on the pages listed below, or by using the keyword search tool below to find specific information within the annual report.-
 1
1 -
2
-
3
-
4
-
5
-
6
-
7
-
8
-
9
-
10
-
11
-
12
-
13
-
14
-
15
-
16
-
17
-
18
-
19
-
20
-
21
-
22
-
23
-
24
-
25
-
26
-
27
-
28
-
29
-
30
-
31
-
32
-
33
-
34
-
35
-
36
-
37
-
38
-
39
-
40
-
41
-
42
-
43
-
44
-
45
-
46
-
47
-
48
-
49
-
50
-
51
-
52
-
53
-
54
-
55
-
56
-
57
-
58
-
59
-
60
-
61
-
62
-
63
-
64
-
65
-
66
-
67
-
68
-
69
-
70
-
71
-
72
-
73
-
74
-
75
-
76
-
77
-
78
-
79
-
80
-
81
-
82
-
83
-
84
-
85
-
86
-
87
-
88
-
89
-
90
-
91
-
92
-
93
-
94
-
95
-
96
-
97
-
98
-
99
-
100
-
101
-
102
-
103
-
104
-
105
-
106
-
107
-
108
-
109
-
110
-
111
-
112
-
113
-
114
-
115
-
116
-
117
-
118
-
119
-
120
-
121
-
122
-
123
-
124
-
125
-
126
-
127
-
128
-
129
-
130
-
131
-
132
-
133
-
134
-
135
-
136
-
 137
137 -
 138
138 -
 139
139 -
 140
140 -
 141
141 -
 142
142 -
 143
143 -
 144
144 -
 145
145 -
 146
146 -
 147
147 -
 148
148 -
 149
149 -
 150
150 -
 151
151 -
 152
152 -
 153
153 -
 154
154 -
 155
155 -
 156
156 -
 157
157 -
158
-
159
-
160
-
161
-
162
-
163
-
164
-
165
-
166
-
167
-
168
-
169
-
170
-
171
-
172
-
173
-
174
-
175
-
176
-
177
-
178
-
179
-
180
-
181
-
182
-
183
-
184
-
185
-
186
 |
 |

YUM! BRANDS, INC.-2015 Form10-K 39
Form 10-K
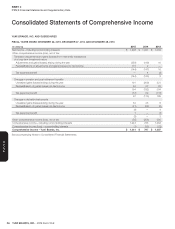
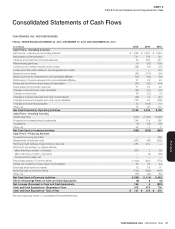
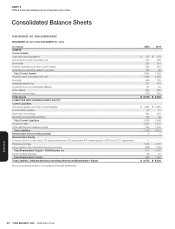
PART II
ITEM 8Financial Statements and Supplementary Data
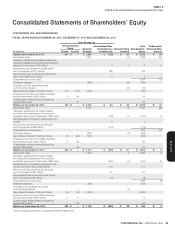
Consolidated Statements of Shareholders’ Equity
YUM! BRANDS, INC. AND SUBSIDIARIES
FISCAL YEARS ENDED DECEMBER 26, 2015, DECEMBER 27, 2014 AND DECEMBER 28, 2013
(in millions)
Yum! Brands, Inc.
Noncontrolling
Interests
Total
Shareholders’
Equity
Redeemable
Noncontrolling
Interest
Issued Common
Stock Retained
Earnings
Accumulated Other
Comprehensive
Income (Loss)Shares Amount
Balance at December 29, 2012 451 $ — $ 2,286 $ (132) $ 99 $ 2,253 $ 59
Net Income (loss) 1,091 (5) 1,086 (22)
Translation adjustments and gains (losses) from
intra-entity transactions of a long-term investment
nature (net of tax impact of $2 million)
4 2 6 2
Pension and post-retirement benefit plans
(netof tax impact of $115 million) 189 189
Net unrealized gain on derivative instruments
(net of tax impact of $1 million) 3 3
Comprehensive Income (loss) 1,284 (20)
Dividends declared (635) (18) (653)
Acquisition of Little Sheep store-level
noncontrolling interests (15) (15)
Repurchase of shares of Common Stock (11) (110) (640) (750)
Employee stock option and SARs exercises
(includes tax impact of $42 million) 3 49 49
Compensation-related events (includes tax
impact of $8 million) 61 61
Balance at December 28, 2013 443 $ — $ 2,102 $ 64 $ 63 $ 2,229 $ 39
Net Income (loss) 1,051 (1) 1,050 (29)
Translation adjustments and gains (losses)
from intra-entity transactions of a long-term
investment nature (net of tax impact of $4million) (143) (1) (144) (1)
Reclassification of translation adjustments into
income 2 2
Pension and post-retirement benefit plans
(net of tax impact of $69 million) (113) (113)
Comprehensive Income (loss) 795 (30)
Dividends declared (691) (4) (695)
Repurchase of shares of Common Stock (11) (95) (725) (820)
Employee stock option and SARs exercises
(includes tax impact of $37 million) 2 33 33
Compensation-related events (includes tax
impact of $5 million) 62 62
Balance at December 27, 2014 434 $ — $ 1,737 $ (190) $ 57 $ 1,604 $ 9
Net Income (loss) 1,293 6 1,299 (1)
Translation adjustments and gains (losses)
from intra-entity transactions of a long-term
investment nature (net of tax impact of $3million) (250) (4) (254) (2)
Reclassification of translation adjustments into
income (net of tax impact of $3 million) 112 112
Pension and post-retirement benefit plans
(net of tax impact of $57 million) 97 97
Net unrealized loss on derivative instruments
(net of tax impact of $1 million) (8) (8)
Comprehensive Income (loss) 1,246 (3)
Dividends declared — (756) (756)
Acquisition of Little Sheep store-level
noncontrolling interests 1 (1) —
Repurchase of shares of Common Stock (16) (76) (1,124)(1,200)
Employee stock option and SARs exercises
(includes tax impact of $43 million) 2 11 11
Compensation-related events (includes tax
impact of $7 million) 64 64
Balance at December 26, 2015 420 $ — $ 1,150 $ (239) $ 58 $ 969 $ 6
See accompanying Notes to Consolidated Financial Statements.