Pizza Hut 2015 Annual Report Download - page 62
Download and view the complete annual report
Please find page 62 of the 2015 Pizza Hut annual report below. You can navigate through the pages in the report by either clicking on the pages listed below, or by using the keyword search tool below to find specific information within the annual report.-
 1
1 -
2
-
3
-
4
-
5
-
6
-
7
-
8
-
9
-
10
-
11
-
12
-
13
-
14
-
15
-
16
-
17
-
18
-
19
-
20
-
21
-
22
-
23
-
24
-
25
-
26
-
27
-
28
-
29
-
30
-
31
-
32
-
33
-
34
-
35
-
36
-
37
-
38
-
39
-
40
-
41
-
42
-
43
-
44
-
45
-
46
-
47
-
48
-
49
-
50
-
51
-
 52
52 -
 53
53 -
 54
54 -
 55
55 -
 56
56 -
 57
57 -
 58
58 -
 59
59 -
 60
60 -
 61
61 -
 62
62 -
 63
63 -
 64
64 -
 65
65 -
 66
66 -
 67
67 -
 68
68 -
 69
69 -
 70
70 -
 71
71 -
 72
72 -
73
-
74
-
75
-
76
-
77
-
78
-
79
-
80
-
81
-
82
-
83
-
84
-
85
-
86
-
87
-
88
-
89
-
90
-
91
-
92
-
93
-
94
-
95
-
96
-
97
-
98
-
99
-
100
-
101
-
102
-
103
-
104
-
105
-
106
-
107
-
108
-
109
-
110
-
111
-
112
-
113
-
114
-
115
-
116
-
117
-
118
-
119
-
120
-
121
-
122
-
123
-
124
-
125
-
126
-
127
-
128
-
129
-
130
-
131
-
132
-
133
-
134
-
135
-
136
-
137
-
138
-
139
-
140
-
141
-
142
-
143
-
144
-
145
-
146
-
147
-
148
-
149
-
150
-
151
-
152
-
153
-
154
-
155
-
156
-
157
-
158
-
159
-
160
-
161
-
162
-
163
-
164
-
165
-
166
-
167
-
168
-
169
-
170
-
171
-
172
-
173
-
174
-
175
-
176
-
177
-
178
-
179
-
180
-
181
-
182
-
183
-
184
-
185
-
186
 |
 |

YUM! BRANDS, INC.-2016Proxy Statement48
Proxy Statement
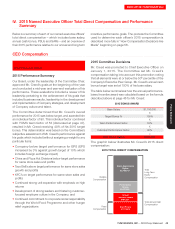
EXECUTIVE COMPENSATION
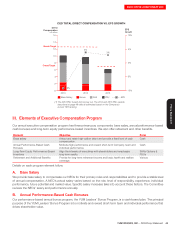
C. Long-Term Equity Performance-Based Incentives
We provide performance-based long-term equity compensation
to our NEOs to encourage long-term decision making that
creates shareholder value. To that end, we use vehicles that
motivate and balance the tradeoffs between short-term and
long-term performance. Performance-based long-term equity
compensation also serves as a retention tool.
Our NEOs are awarded long-term incentives annually based
on the Committee’s subjective assessment of the following
items for each NEO (without assigning weight to any
particularitem):
•Prior year individual and team performance
•Expected contribution in future years
•
Consideration of the market value of the executive’s role
compared with similar roles in our Executive Peer Group
•Achievement of stock ownership guidelines
Equity Mix
Each year, the Committee reviews the mix of long-term
incentives to determine if it is appropriate to continue
predominantly using SARs/Options as the long-term incentive
vehicle. For 2015, the Committee continued to choose
SARs/Options and PSU awards because these equity
vehicles focus and reward management to enhance long-
term shareholder value, thereby aligning our NEOs with the
interests of our shareholders.
At the beginning of 2015, the Committee determined each
NEO’s target grant value and the split of that value between
SARs/Options and PSU grants. For the CEO, his target
grant value was split 75% SARs/Options and 25% PSUs.
For the other NEOs, their target grant values were split
80% SARs/Options and 20% PSUs. The Committee awarded
predominantly SARs/Options because it believed it aligns
executives and incentives them to drive a long-term growth
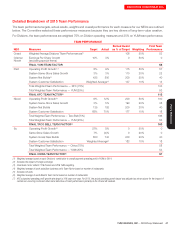
in the business. For each NEO, the breakdown between
SARs/Options award values and PSU award values can
be found under the Summary Compensation Table, page
62 at columns e and f.
Stock Appreciation Rights/Stock Options
In 2015, we granted to each of our NEOs SARs/Options
which have ten-year terms and vest over at least four
years. The exercise price of each SARs/Options grant was
based on the closing market price of the underlying YUM
common stock on the date of grant. Therefore, SARs/Options
awards will only have value if our NEOs are successful in
increasing share price above the awards’ exercise price.
Performance Share Plan
Under the Company’s Performance Share Plan, we granted
to each of our NEOs PSU awards in 2015. PSU awards
are earned based on the Company’s 3-year average TSR
relative to the companies in the S&P 500. Incorporating
TSR supports the Company’s pay-for-performance philosophy
while diversifying performance criteria by using measures
not used in the annual bonus plan and aligning our NEOs’
reward with the creation of shareholder value.
The threshold and maximum share payouts are aggressively
set, exceeding market best practice. The target, threshold
and maximum shares that may be paid out under these
awards for each NEO are described at page 64.
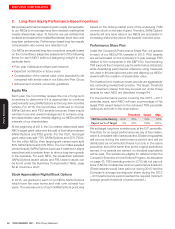
For the performance period covering the 2015 – 2017
calendar years, each NEO will earn a percentage of his
target PSU award based on the achieved TSR percentile
ranking as set forth in the chart below:
Threshold Target Max.
TSR Percentile Ranking <40% 40% 50% 90%
Payout as % of Target 0% 50% 100% 200%
We set target long-term incentive pay at the 50
th
percentile.
Therefore, for on-target performance we pay at the median,
which is consistent with market practice. Dividend equivalents
will accrue during the performance period and will be
distributed as incremental shares but only in the same
proportion and at the same time as the original awards are
earned. If no awards are earned, no dividend equivalents
will be paid. The awards are eligible for deferral under the
Company’s Executive Income Deferral Program. As discussed
on page43, PSU awards granted in 2012 did not pay out
since YUM did not attain the minimum performance threshold.
(These awards would have paid out during 2015 had the
Company’s average earnings per share during the 2012
– 2014 performance period reached the required minimum
average growth threshold of seven percent.)