Pizza Hut 2015 Annual Report Download - page 135
Download and view the complete annual report
Please find page 135 of the 2015 Pizza Hut annual report below. You can navigate through the pages in the report by either clicking on the pages listed below, or by using the keyword search tool below to find specific information within the annual report.-
 1
1 -
2
-
3
-
4
-
5
-
6
-
7
-
8
-
9
-
10
-
11
-
12
-
13
-
14
-
15
-
16
-
17
-
18
-
19
-
20
-
21
-
22
-
23
-
24
-
25
-
26
-
27
-
28
-
29
-
30
-
31
-
32
-
33
-
34
-
35
-
36
-
37
-
38
-
39
-
40
-
41
-
42
-
43
-
44
-
45
-
46
-
47
-
48
-
49
-
50
-
51
-
52
-
53
-
54
-
55
-
56
-
57
-
58
-
59
-
60
-
61
-
62
-
63
-
64
-
65
-
66
-
67
-
68
-
69
-
70
-
71
-
72
-
73
-
74
-
75
-
76
-
77
-
78
-
79
-
80
-
81
-
82
-
83
-
84
-
85
-
86
-
87
-
88
-
89
-
90
-
91
-
92
-
93
-
94
-
95
-
96
-
97
-
98
-
99
-
100
-
101
-
102
-
103
-
104
-
105
-
106
-
107
-
108
-
109
-
110
-
111
-
112
-
113
-
114
-
115
-
116
-
117
-
118
-
119
-
120
-
121
-
122
-
123
-
124
-
 125
125 -
 126
126 -
 127
127 -
 128
128 -
 129
129 -
 130
130 -
 131
131 -
 132
132 -
 133
133 -
 134
134 -
 135
135 -
 136
136 -
 137
137 -
 138
138 -
 139
139 -
 140
140 -
 141
141 -
 142
142 -
 143
143 -
 144
144 -
 145
145 -
146
-
147
-
148
-
149
-
150
-
151
-
152
-
153
-
154
-
155
-
156
-
157
-
158
-
159
-
160
-
161
-
162
-
163
-
164
-
165
-
166
-
167
-
168
-
169
-
170
-
171
-
172
-
173
-
174
-
175
-
176
-
177
-
178
-
179
-
180
-
181
-
182
-
183
-
184
-
185
-
186
 |
 |

YUM! BRANDS, INC.-2015 Form10-K 27
Form 10-K
PART II
ITEM7Management’s Discussion and Analysis of Financial Condition and Results of Operations
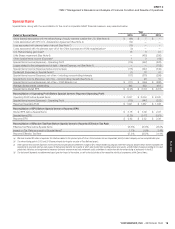
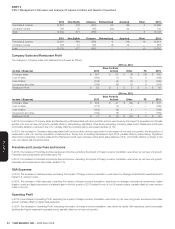
Corporate & Unallocated
% B/(W)
Income / (Expense) 2015 2014 2013 2015 2014
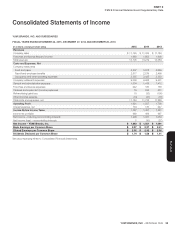
Corporate G&A expenses $ (204) $ (189) $ (207) (7) 9
Unallocated franchise and license expenses (71) — — NM —
Unallocated closures and impairments — (463) (295) NM (57)
Refranchising gain (loss) (See Note 4) (10) 33 100 NM (67)
Other unallocated (37) (11) (6) NM (78)
Interest expense, net (134) (130) (247) (4) 47
Income tax provision (See Note 16) (489) (406) (487) (20) 17
Effective tax rate (See Note 16) 27.3% 28.5% 31.4% 1.2 ppts. 2.9 ppts.
Corporate G&A Expenses
In 2015, the increase in Corporate G&A expenses was driven by higher professional fees and higher pension costs.
In 2014, the decrease in Corporate G&A expenses was driven by lower pension costs, including lapping higher pension settlement charges, partially
offset by higher professional fees.
Unallocated Franchise and License expenses
In 2015, Unallocated franchise and license expenses represent charges related to the KFC U.S. acceleration agreement. See Note 4.
Unallocated Closures and Impairments
In 2014 and 2013, Unallocated closures and impairments represent Little Sheep impairment charges. See Note 4.
Other Unallocated
In 2015, Other unallocated primarily includes foreign exchange losses and a write-down related to our decision to dispose of a corporate aircraft in China.
In 2014 and 2013, Other unallocated primarily includes foreign exchange losses.
Interest Expense, Net
The increase in interest expense, net for 2015 was driven by increased net short-term borrowings.
The decrease in interest expense, net for 2014 was driven by lapping $118million of premiums paid and other costs related to the extinguishment of
debt in 2013. See Note 4.
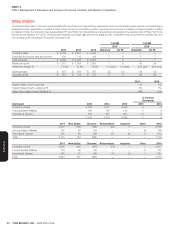
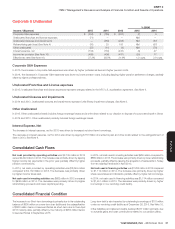
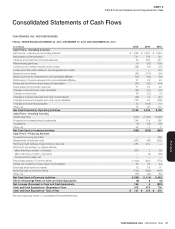
Consolidated Cash Flows
Net cash provided by operating activities was $2,139 million in 2015
versus $2,049 million in 2014. The increase was primarily driven by lapping
higher income tax payments in the prior year, partially offset by higher
pension contributions.
In 2014, net cash provided by operating activities was $2,049 million
compared to $2,139 million in 2013. The decrease was primarily driven
by higher income taxes paid.
Net cash used in investing activities was $682 million in 2015 compared
to $936 million in 2014. The decrease was primarily driven by higher
refranchising proceeds and lower capital spending.
In 2014, net cash used in investing activities was $936 million compared to
$886 million in 2013. The increase was primarily driven by lower refranchising
proceeds, partially offset by lapping the acquisition of restaurants in Turkey
from an existing franchisee in April 2013.
Net cash used in financing activities was $1,292 million in 2015 compared
to $1,114 million in 2014. The increase was primarily driven by higher
share repurchases and dividends, partially offset by higher net borrowings.
In 2014, net cash used in financing activities was $1,114 million compared
to $1,451 million in 2013. The decrease was primarily driven by higher
borrowings on our revolving credit facility.
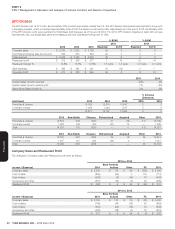
Consolidated Financial Condition
The increase in our Short-term borrowings is primarily due to the outstanding
balance of $600 million on a new term loan facility and the reclassification
of $300 million Senior Unsecured Notes as short-term due to their April
2016 maturity date, partially offset by the maturity of $250 million Senior
Unsecured Notes in September 2015.
Long-term debt is also impacted by outstanding borrowings of $701 million
under our revolving credit facility as of December 26, 2015. See Note 10.
Other liabilities and deferred credits declined $277 million primarily due
to actuarial gains and cash contributions related to our pension plans.