Pizza Hut 2015 Annual Report Download - page 59
Download and view the complete annual report
Please find page 59 of the 2015 Pizza Hut annual report below. You can navigate through the pages in the report by either clicking on the pages listed below, or by using the keyword search tool below to find specific information within the annual report.-
 1
1 -
2
-
3
-
4
-
5
-
6
-
7
-
8
-
9
-
10
-
11
-
12
-
13
-
14
-
15
-
16
-
17
-
18
-
19
-
20
-
21
-
22
-
23
-
24
-
25
-
26
-
27
-
28
-
29
-
30
-
31
-
32
-
33
-
34
-
35
-
36
-
37
-
38
-
39
-
40
-
41
-
42
-
43
-
44
-
45
-
46
-
47
-
48
-
 49
49 -
 50
50 -
 51
51 -
 52
52 -
 53
53 -
 54
54 -
 55
55 -
 56
56 -
 57
57 -
 58
58 -
 59
59 -
 60
60 -
 61
61 -
 62
62 -
 63
63 -
 64
64 -
 65
65 -
 66
66 -
 67
67 -
 68
68 -
 69
69 -
70
-
71
-
72
-
73
-
74
-
75
-
76
-
77
-
78
-
79
-
80
-
81
-
82
-
83
-
84
-
85
-
86
-
87
-
88
-
89
-
90
-
91
-
92
-
93
-
94
-
95
-
96
-
97
-
98
-
99
-
100
-
101
-
102
-
103
-
104
-
105
-
106
-
107
-
108
-
109
-
110
-
111
-
112
-
113
-
114
-
115
-
116
-
117
-
118
-
119
-
120
-
121
-
122
-
123
-
124
-
125
-
126
-
127
-
128
-
129
-
130
-
131
-
132
-
133
-
134
-
135
-
136
-
137
-
138
-
139
-
140
-
141
-
142
-
143
-
144
-
145
-
146
-
147
-
148
-
149
-
150
-
151
-
152
-
153
-
154
-
155
-
156
-
157
-
158
-
159
-
160
-
161
-
162
-
163
-
164
-
165
-
166
-
167
-
168
-
169
-
170
-
171
-
172
-
173
-
174
-
175
-
176
-
177
-
178
-
179
-
180
-
181
-
182
-
183
-
184
-
185
-
186
 |
 |

YUM! BRANDS, INC.-2016Proxy Statement 45
Proxy Statement
EXECUTIVE COMPENSATION
0
2
4
6
8
10
12
14
16
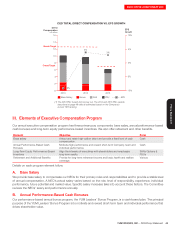
2013 2014 2015
4%
3%
Direct
Compensation
in $ millions
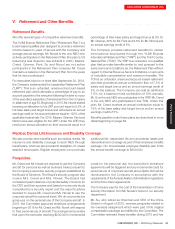
CEO TOTAL DIRECT COMPENSATION VS. EPS GROWTH
EPS
Growth
Novak Target
Base Salary Bonus PSUSAR EPS
(1) The 2013 PSU Award did not pay out. The 2014 and 2015 PSU awards,
described at page 48 reflects estimates based on the Company’s
current TSR ranking.
Creed Target
-10%
-5%
0%
5%
10%
9%
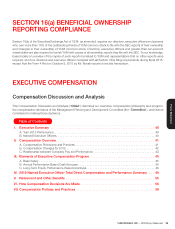
III. Elements of Executive Compensation Program
Our annual executive compensation program has three primary pay components: base salary, annual performance-based
cash bonuses and long-term equity performance-based incentives. We also offer retirement and other benefits.
Element Objective Form
Base salary Attract and retain high-caliber talent and provide a fixed level of cash
compensation.
Cash
Annual Performance-Based Cash
Bonuses
Motivate high performance and reward short-term Company, team and
individual performance.
Cash
Long-Term Equity Performance-Based
Incentives
Align the interests of executives with shareholders and emphasize
long-term results.
SARs/Options &
PSUs
Retirement and Additional Benefits Provide for long-term retirement income and basic health and welfare
coverage.
Various
Details on each program element follow.
A. Base Salary
We provide base salary to compensate our NEOs for their primary roles and responsibilities and to provide a stable level
of annual compensation. A NEO’s actual salary varies based on the role, level of responsibility, experience, individual
performance, future potential and market value. Specific salary increases take into account these factors. The Committee
reviews the NEOs’ salary and performance annually.
B. Annual Performance-Based Cash Bonuses
Our performance-based annual bonus program, the YUM Leaders’ Bonus Program, is a cash-based plan. The principal
purpose of the YUM Leaders’ Bonus Program is to motivate and reward short-term team and individual performance that
drives shareholder value.