Pizza Hut 2015 Annual Report Download - page 145
Download and view the complete annual report
Please find page 145 of the 2015 Pizza Hut annual report below. You can navigate through the pages in the report by either clicking on the pages listed below, or by using the keyword search tool below to find specific information within the annual report.-
 1
1 -
2
-
3
-
4
-
5
-
6
-
7
-
8
-
9
-
10
-
11
-
12
-
13
-
14
-
15
-
16
-
17
-
18
-
19
-
20
-
21
-
22
-
23
-
24
-
25
-
26
-
27
-
28
-
29
-
30
-
31
-
32
-
33
-
34
-
35
-
36
-
37
-
38
-
39
-
40
-
41
-
42
-
43
-
44
-
45
-
46
-
47
-
48
-
49
-
50
-
51
-
52
-
53
-
54
-
55
-
56
-
57
-
58
-
59
-
60
-
61
-
62
-
63
-
64
-
65
-
66
-
67
-
68
-
69
-
70
-
71
-
72
-
73
-
74
-
75
-
76
-
77
-
78
-
79
-
80
-
81
-
82
-
83
-
84
-
85
-
86
-
87
-
88
-
89
-
90
-
91
-
92
-
93
-
94
-
95
-
96
-
97
-
98
-
99
-
100
-
101
-
102
-
103
-
104
-
105
-
106
-
107
-
108
-
109
-
110
-
111
-
112
-
113
-
114
-
115
-
116
-
117
-
118
-
119
-
120
-
121
-
122
-
123
-
124
-
125
-
126
-
127
-
128
-
129
-
130
-
131
-
132
-
133
-
134
-
 135
135 -
 136
136 -
 137
137 -
 138
138 -
 139
139 -
 140
140 -
 141
141 -
 142
142 -
 143
143 -
 144
144 -
 145
145 -
 146
146 -
 147
147 -
 148
148 -
 149
149 -
 150
150 -
 151
151 -
 152
152 -
 153
153 -
 154
154 -
 155
155 -
156
-
157
-
158
-
159
-
160
-
161
-
162
-
163
-
164
-
165
-
166
-
167
-
168
-
169
-
170
-
171
-
172
-
173
-
174
-
175
-
176
-
177
-
178
-
179
-
180
-
181
-
182
-
183
-
184
-
185
-
186
 |
 |

YUM! BRANDS, INC.-2015 Form10-K 37
Form 10-K
PART II
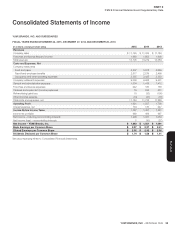
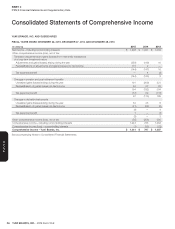
ITEM 8Financial Statements and Supplementary Data
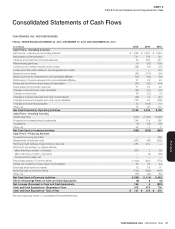
Consolidated Statements of Cash Flows
YUM! BRANDS, INC. AND SUBSIDIARIES
FISCAL YEARS ENDED DECEMBER 26, 2015, DECEMBER 27, 2014 AND DECEMBER 28, 2013
(in millions)
2015 2014 2013
Cash Flows – Operating Activities
Net Income – including noncontrolling interests $ 1,298 $ 1,021 $ 1,064
Depreciation and amortization 747 739 721
Closures and impairment (income) expenses 79 535 331
Refranchising (gain) loss 10 (33) (100)
Contributions to defined benefit pension plans (98) (18) (23)
Losses and other costs related to the extinguishment of debt — — 120
Deferred income taxes (89) (172) (24)
Equity income from investments in unconsolidated affiliates (41) (30) (26)
Distributions of income received from unconsolidated affiliates 21 28 43
Excess tax benefit from share-based compensation (50) (42) (44)
Share-based compensation expense 57 55 49
Changes in accounts and notes receivable (54) (21) (12)
Changes in inventories 58 (22) 18
Changes in prepaid expenses and other current assets (22) 12 (21)
Changes in accounts payable and other current liabilities 128 60 (102)
Changes in income taxes payable 20 (143) 14
Other, net 75 80 131
Net Cash Provided by Operating Activities 2,139 2,049 2,139
Cash Flows – Investing Activities
Capital spending (973) (1,033) (1,049)
Proceeds from refranchising of restaurants 246 114 260
Acquisitions (9) (28) (99)
Other, net 54 11 2
Net Cash Used in Investing Activities (682) (936) (886)
Cash Flows – Financing Activities
Proceeds from long-term debt — — 599
Repayments of long-term debt (263) (66) (666)
Revolving credit facilities, three months or less, net 285 416 —
Short-term borrowings, by original maturity
More than three months – proceeds 609 2 56
More than three months – payments — (2) (56)
Three months or less, net — — —
Repurchase shares of Common Stock (1,200) (820) (770)
Excess tax benefit from share-based compensation 50 42 44
Employee stock option proceeds 12 29 37
Dividends paid on Common Stock (730) (669) (615)
Other, net (55) (46) (80)
Net Cash Used in Financing Activities (1,292) (1,114) (1,451)
Effect of Exchange Rates on Cash and Cash Equivalents (6) 6 (5)
Net Increase (Decrease) in Cash and Cash Equivalents 159 5 (203)
Cash and Cash Equivalents – Beginning of Year 578 573 776
Cash and Cash Equivalents – End of Year $ 737 $ 578 $ 573
See accompanying Notes to Consolidated Financial Statements.