Pizza Hut 2015 Annual Report Download - page 170
Download and view the complete annual report
Please find page 170 of the 2015 Pizza Hut annual report below. You can navigate through the pages in the report by either clicking on the pages listed below, or by using the keyword search tool below to find specific information within the annual report.-
 1
1 -
2
-
3
-
4
-
5
-
6
-
7
-
8
-
9
-
10
-
11
-
12
-
13
-
14
-
15
-
16
-
17
-
18
-
19
-
20
-
21
-
22
-
23
-
24
-
25
-
26
-
27
-
28
-
29
-
30
-
31
-
32
-
33
-
34
-
35
-
36
-
37
-
38
-
39
-
40
-
41
-
42
-
43
-
44
-
45
-
46
-
47
-
48
-
49
-
50
-
51
-
52
-
53
-
54
-
55
-
56
-
57
-
58
-
59
-
60
-
61
-
62
-
63
-
64
-
65
-
66
-
67
-
68
-
69
-
70
-
71
-
72
-
73
-
74
-
75
-
76
-
77
-
78
-
79
-
80
-
81
-
82
-
83
-
84
-
85
-
86
-
87
-
88
-
89
-
90
-
91
-
92
-
93
-
94
-
95
-
96
-
97
-
98
-
99
-
100
-
101
-
102
-
103
-
104
-
105
-
106
-
107
-
108
-
109
-
110
-
111
-
112
-
113
-
114
-
115
-
116
-
117
-
118
-
119
-
120
-
121
-
122
-
123
-
124
-
125
-
126
-
127
-
128
-
129
-
130
-
131
-
132
-
133
-
134
-
135
-
136
-
137
-
138
-
139
-
140
-
141
-
142
-
143
-
144
-
145
-
146
-
147
-
148
-
149
-
150
-
151
-
152
-
153
-
154
-
155
-
156
-
157
-
158
-
159
-
 160
160 -
 161
161 -
 162
162 -
 163
163 -
 164
164 -
 165
165 -
 166
166 -
 167
167 -
 168
168 -
 169
169 -
 170
170 -
 171
171 -
 172
172 -
 173
173 -
 174
174 -
 175
175 -
 176
176 -
 177
177 -
 178
178 -
 179
179 -
 180
180 -
181
-
182
-
183
-
184
-
185
-
186
 |
 |

YUM! BRANDS, INC.-2015 Form10-K62
Form 10-K
PART II
ITEM 8Financial Statements and Supplementary Data
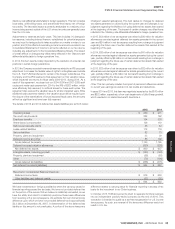
Identifiable Assets
2015 2014
China(f) $ 3,150 $ 3,202
KFC Division(i) 2,181 2,328
Pizza Hut Division(i) 707 710
Taco Bell Division(i) 1,127 1,084
India 84 118
Corporate(g)(i) 826 892
$ 8,075 $ 8,334
Long-Lived Assets(h)
2015 2014
China $ 2,033 $ 2,217
KFC Division 1,663 1,823
Pizza Hut Division 419 433
Taco Bell Division 911 920
India 35 72
Corporate 55 51
$ 5,116 $ 5,516
(a) U.S. revenues included in the combined KFC, Pizza Hut and Taco Bell Divisions totaled $3.1 billion in 2015 and $3.0 billion in both 2014 and 2013.
(b) Includes equity income from investments in unconsolidated affiliates of $41 million, $30 million and $26 million in 2015, 2014 and 2013, respectively.
(c) Amounts have not been allocated to any segment for performance reporting purposes.
(d) Represents 2014 and 2013 impairment losses related to Little Sheep. See Note 4.
(e) 2013 includes $118 million of premiums and other costs related to the extinguishment of debt. See Note 4.
(f) China includes investments in 4 unconsolidated affiliates totaling $61 million and $52 million for 2015 and 2014, respectively.
(g) Primarily includes cash, deferred tax assets and property, plant and equipment, net, related to our office facilities.
(h) Includes property, plant and equipment, net, goodwill, and intangible assets, net.
(i) U.S. identifiable assets included in the combined Corporate and KFC, Pizza Hut and Taco Bell Divisions totaled $2.3 billion and $2.0 billion in 2015 and 2014, respectively.
(j) Represents 2015 costs associated with the KFC U.S. Acceleration Agreement. See Note 4.
NOTE18 Contingencies
Lease Guarantees
As a result of having (a) assigned our interest in obligations under real estate
leases as a condition to the refranchising of certain Company restaurants;
(b) contributed certain Company restaurants to unconsolidated affiliates;
and (c) guaranteed certain other leases, we are frequently contingently
liable on lease agreements. These leases have varying terms, the latest
of which expires in 2065. As of December 26, 2015, the potential amount
of undiscounted payments we could be required to make in the event
of non-payment by the primary lessee was approximately $575 million.
The present value of these potential payments discounted at our pre-tax
cost of debt at December 26, 2015 was approximately $475 million.
Our franchisees are the primary lessees under the vast majority of these
leases. We generally have cross-default provisions with these franchisees
that would put them in default of their franchise agreement in the event of
non-payment under the lease. We believe these cross-default provisions
significantly reduce the risk that we will be required to make payments
under these leases. Accordingly, the liability recorded for our probable
exposure under such leases at December 26, 2015 and December 27,
2014 was not material.
Franchise Loan Pool and Equipment
Guarantees
We have agreed to provide financial support, if required, to a variable interest
entity that operates a franchisee lending program used primarily to assist
franchisees in the development of new restaurants or the upgrade of existing
restaurants and, to a lesser extent, in connection with the Company’s
refranchising programs in the U.S. We have determined that we are not
required to consolidate this entity as we share the power to direct this
entity’s lending activity with other parties. We have provided guarantees
of 20% of the outstanding loans of the franchisee loan program. As such,
at December 26, 2015 our guarantee exposure under this program is
approximately $6 million based on total loans outstanding of $29 million.
In addition to the guarantees described above, YUM has agreed to provide
guarantees of up to approximately $140 million on behalf of franchisees
for several financing programs related to specific initiatives, primarily
equipment purchases. At December 26, 2015 our guarantee exposure
under these financing programs is approximately $14 million based on
total loans outstanding of $38 million.