Pizza Hut 2015 Annual Report Download - page 165
Download and view the complete annual report
Please find page 165 of the 2015 Pizza Hut annual report below. You can navigate through the pages in the report by either clicking on the pages listed below, or by using the keyword search tool below to find specific information within the annual report.-
 1
1 -
2
-
3
-
4
-
5
-
6
-
7
-
8
-
9
-
10
-
11
-
12
-
13
-
14
-
15
-
16
-
17
-
18
-
19
-
20
-
21
-
22
-
23
-
24
-
25
-
26
-
27
-
28
-
29
-
30
-
31
-
32
-
33
-
34
-
35
-
36
-
37
-
38
-
39
-
40
-
41
-
42
-
43
-
44
-
45
-
46
-
47
-
48
-
49
-
50
-
51
-
52
-
53
-
54
-
55
-
56
-
57
-
58
-
59
-
60
-
61
-
62
-
63
-
64
-
65
-
66
-
67
-
68
-
69
-
70
-
71
-
72
-
73
-
74
-
75
-
76
-
77
-
78
-
79
-
80
-
81
-
82
-
83
-
84
-
85
-
86
-
87
-
88
-
89
-
90
-
91
-
92
-
93
-
94
-
95
-
96
-
97
-
98
-
99
-
100
-
101
-
102
-
103
-
104
-
105
-
106
-
107
-
108
-
109
-
110
-
111
-
112
-
113
-
114
-
115
-
116
-
117
-
118
-
119
-
120
-
121
-
122
-
123
-
124
-
125
-
126
-
127
-
128
-
129
-
130
-
131
-
132
-
133
-
134
-
135
-
136
-
137
-
138
-
139
-
140
-
141
-
142
-
143
-
144
-
145
-
146
-
147
-
148
-
149
-
150
-
151
-
152
-
153
-
154
-
 155
155 -
 156
156 -
 157
157 -
 158
158 -
 159
159 -
 160
160 -
 161
161 -
 162
162 -
 163
163 -
 164
164 -
 165
165 -
 166
166 -
 167
167 -
 168
168 -
 169
169 -
 170
170 -
 171
171 -
 172
172 -
 173
173 -
 174
174 -
 175
175 -
176
-
177
-
178
-
179
-
180
-
181
-
182
-
183
-
184
-
185
-
186
 |
 |

YUM! BRANDS, INC.-2015 Form10-K 57
Form 10-K
PART II
ITEM 8Financial Statements and Supplementary Data
Award Activity
Stock Options and SARs
Shares
(in thousands)
Weighted-Average
Exercise Price
Weighted-Average
Remaining
Contractual Term
(years)
Aggregate
Intrinsic Value
(in millions)
Outstanding at the beginning of the year 27,172 $ 46.68
Granted 3,811 74.32
Exercised (4,089) 35.25
Forfeited or expired (961) 65.86
Outstanding at the end of the year 25,933(a) $ 51.79 5.41 $ 577
Exercisable at the end of the year 17,084 $ 42.49 4.03 $ 538
(a) Outstanding awards include 1,623 options and 24,310 SARs with weighted average exercise prices of $49.34 and $51.98, respectively.
The weighted-average grant-date fair value of stock options and SARs granted during 2015, 2014 and 2013 was $15.95, $17.28 and $14.67, respectively.
The total intrinsic value of stock options and SARs exercised during the years ended December 26, 2015, December 27, 2014 and December 28, 2013,
was $186 million, $157 million and $176 million, respectively.
As of December 26, 2015, $89 million of unrecognized compensation cost related to unvested stock options and SARs, which will be reduced by any
forfeitures that occur, is expected to be recognized over a remaining weighted-average period of approximately 1.8 years. The total fair value at grant
date of awards that vested during 2015, 2014 and 2013 was $48 million, $41 million and $51 million, respectively.
RSUs and PSUs
As of December 26, 2015, there was $8 million of unrecognized compensation cost related to 0.5 million unvested RSUs and PSUs.
Impact on Net Income
The components of share-based compensation expense and the related income tax benefits are shown in the following table:
2015 2014 2013
Options and SARs $ 50 $ 48 $ 44
Restricted Stock Units 4 6 6
Performance Share Units 3 1 (1)
Total Share-based Compensation Expense $ 57 $ 55 $ 49
Deferred Tax Benefit recognized $ 18 $ 17 $ 15
EID compensation expense not share-based $ 1 $ 8 $ 11
Cash received from stock option exercises for 2015, 2014 and 2013, was $12 million, $29 million and $37 million, respectively. Tax benefits realized
on our tax returns from tax deductions associated with share-based compensation for 2015, 2014 and 2013 totaled $66 million, $61 million and
$65million, respectively.
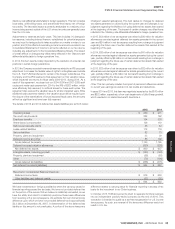
NOTE15 Shareholders’ Equity
Under the authority of our Board of Directors, we repurchased shares of our Common Stock during 2015, 2014 and 2013. All amounts exclude
applicable transaction fees.
Authorization Date
Shares Repurchased
(thousands)
Dollar Value of Shares
Repurchased
2015 2014 2013 2015 2014 2013
December 2015 932 — — $ 67 $ — $ —
November 2014 13,231 — — 1,000 — —
November 2013 1,779 8,488 — 133 617 —
November 2012 — 2,737 10,922 — 203 750
Total 15,942 11,225 10,922(a) $ 1,200 $ 820 $ 750(a)
(a) 2013 amount excludes the effect of $20 million in share repurchases (0.3 million shares) with trade dates prior to the 2012 fiscal year end but with settlement dates subsequent to the
2012 fiscal year end.
On December 8, 2015, our Board of Directors authorized share repurchases through December 2016 of up to $1 billion (excluding applicable transaction fees)
of our outstanding Common Stock. As of December 26, 2015, we have $933 million available for future repurchases under this authorization.