Pizza Hut 2015 Annual Report Download - page 169
Download and view the complete annual report
Please find page 169 of the 2015 Pizza Hut annual report below. You can navigate through the pages in the report by either clicking on the pages listed below, or by using the keyword search tool below to find specific information within the annual report.-
 1
1 -
2
-
3
-
4
-
5
-
6
-
7
-
8
-
9
-
10
-
11
-
12
-
13
-
14
-
15
-
16
-
17
-
18
-
19
-
20
-
21
-
22
-
23
-
24
-
25
-
26
-
27
-
28
-
29
-
30
-
31
-
32
-
33
-
34
-
35
-
36
-
37
-
38
-
39
-
40
-
41
-
42
-
43
-
44
-
45
-
46
-
47
-
48
-
49
-
50
-
51
-
52
-
53
-
54
-
55
-
56
-
57
-
58
-
59
-
60
-
61
-
62
-
63
-
64
-
65
-
66
-
67
-
68
-
69
-
70
-
71
-
72
-
73
-
74
-
75
-
76
-
77
-
78
-
79
-
80
-
81
-
82
-
83
-
84
-
85
-
86
-
87
-
88
-
89
-
90
-
91
-
92
-
93
-
94
-
95
-
96
-
97
-
98
-
99
-
100
-
101
-
102
-
103
-
104
-
105
-
106
-
107
-
108
-
109
-
110
-
111
-
112
-
113
-
114
-
115
-
116
-
117
-
118
-
119
-
120
-
121
-
122
-
123
-
124
-
125
-
126
-
127
-
128
-
129
-
130
-
131
-
132
-
133
-
134
-
135
-
136
-
137
-
138
-
139
-
140
-
141
-
142
-
143
-
144
-
145
-
146
-
147
-
148
-
149
-
150
-
151
-
152
-
153
-
154
-
155
-
156
-
157
-
158
-
 159
159 -
 160
160 -
 161
161 -
 162
162 -
 163
163 -
 164
164 -
 165
165 -
 166
166 -
 167
167 -
 168
168 -
 169
169 -
 170
170 -
 171
171 -
 172
172 -
 173
173 -
 174
174 -
 175
175 -
 176
176 -
 177
177 -
 178
178 -
 179
179 -
180
-
181
-
182
-
183
-
184
-
185
-
186
 |
 |

YUM! BRANDS, INC.-2015 Form10-K 61
Form 10-K
PART II
ITEM 8Financial Statements and Supplementary Data
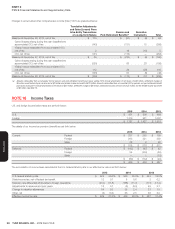
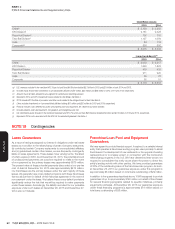
NOTE17 Reportable Operating Segments
See Note 1 for a description of our operating segments.
Revenues
2015 2014 2013
China $ 6,909 $ 6,934 $ 6,905
KFC Division(a) 2,948 3,193 3,036
Pizza Hut Division(a) 1,145 1,148 1,147
Taco Bell Division(a) 1,988 1,863 1,869
India 115 141 127
$13,105 $13,279 $ 13,084
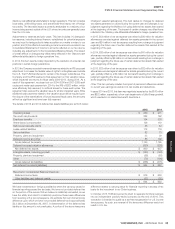
Operating Profit; Interest Expense, Net;
and Income Before Income Taxes
2015 2014 2013
China(b) $ 757 $ 713 $ 777
KFC Division 677 708 649
Pizza Hut Division 289 295 339
Taco Bell Division 539 480 456
India (19) (9) (15)
Unallocated restaurant costs(c) — (1) —
Unallocated Franchise and License expenses(c)(j) (71) — —
Unallocated and corporate expenses(c) (204) (189) (207)
Unallocated Closures and impairment expense(c)(d) — (463) (295)
Unallocated Refranchising gain (loss)(c) (10) 33 100
Unallocated Other income (expense)(c) (37) (10) (6)
Operating Profit 1,921 1,557 1,798
Interest expense, net(c)(e) (134) (130) (247)
Income Before Income Taxes $ 1,787 $ 1,427 $ 1,551
Depreciation and Amortization
2015 2014 2013
China $ 425 $ 411 $ 394
KFC Division 176 187 190
Pizza Hut Division 40 39 36
Taco Bell Division 88 83 84
India 10 10 9
Corporate 8 9 8
$ 747 $ 739 $ 721
Capital Spending
2015 2014 2013
China $ 512 $ 525 $ 568
KFC Division 273 273 294
Pizza Hut Division 54 62 52
Taco Bell Division 116 143 100
India 7 21 31
Corporate 11 9 4
$ 973 $ 1,033 $ 1,049